Dashboard
The dashboard is an operations tool that lets you intuitively monitor in-store visitor paths, demographic characteristics, and real-time dwell status. By combining real-time data with same-day statistical analysis, it supports fast decision-making and on-the-ground response.
1. Key features
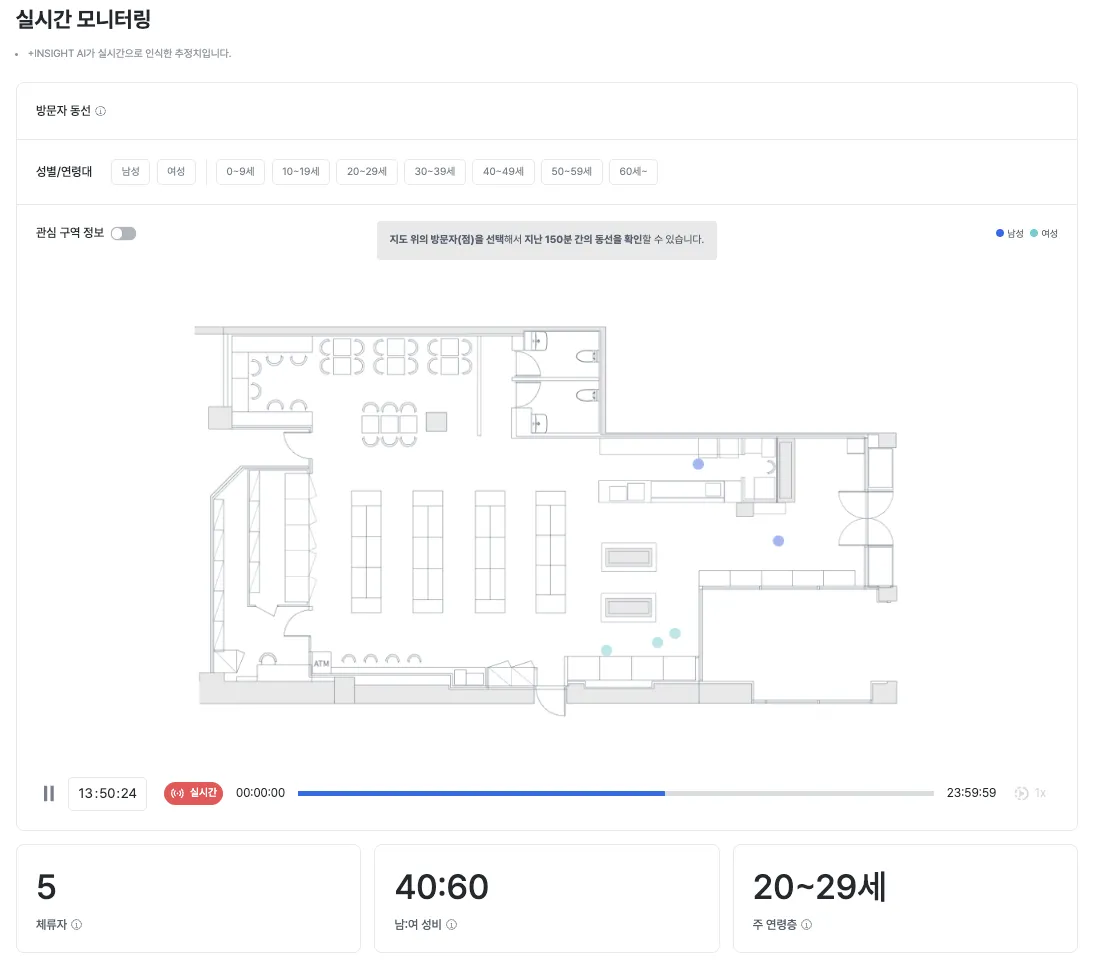
1.1 Visitor path tracking
- Description: View visitors’ movement paths inside the store in real time.
- Use cases: Identify congested zones, optimize product displays, adjust staff placement.
1.2 Gender / age group filter
- Description: Filter visitor data by gender or age group.
- Use cases: Analyze the behavioral patterns of specific target customer segments and plan tailored promotions.
1.3 Map display
- Description: Show visitors’ current locations on the store map.
- Use cases: Monitor congested areas and track the number of people dwelling in each zone in real time.
2. Today’s statistics
2.1 Current dwellers
- Description: Displays the number of visitors currently in the store in real time.
- Use cases: Assess store congestion and respond based on safety management thresholds.
2.2 Gender ratio
- Description: Provides the ratio of male to female visitors currently in the store.
- Use cases: Adjust marketing messages based on shifts in the gender ratio.
2.3 Top age group
- Description: Shows the age group that makes up the largest share of today’s visitors.
- Use cases: Tailor product placement and select promotion targets by age group.
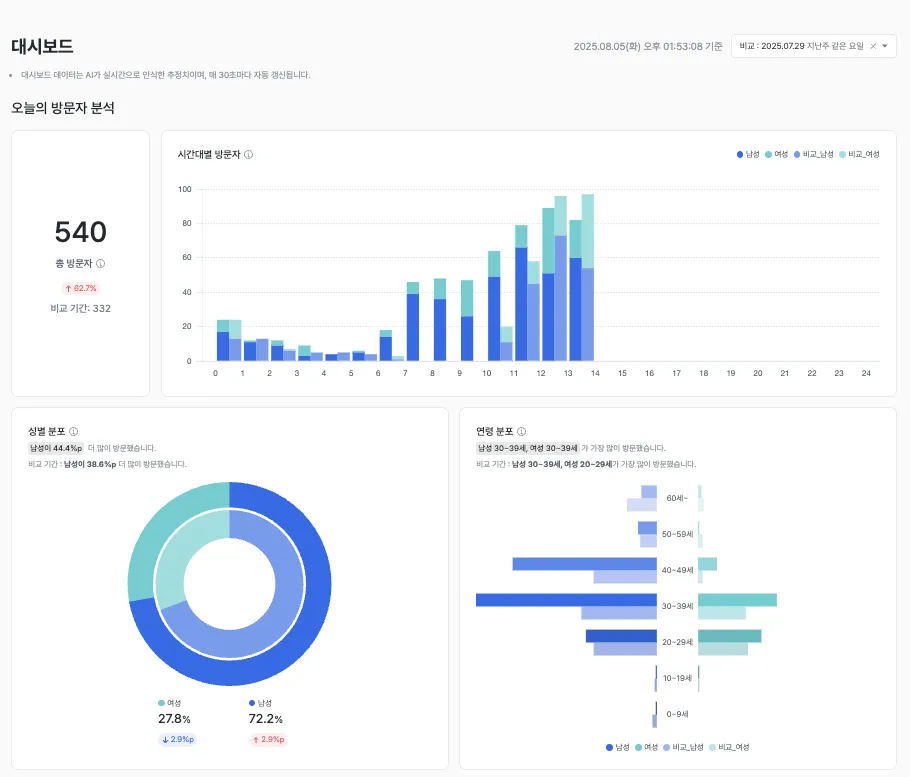
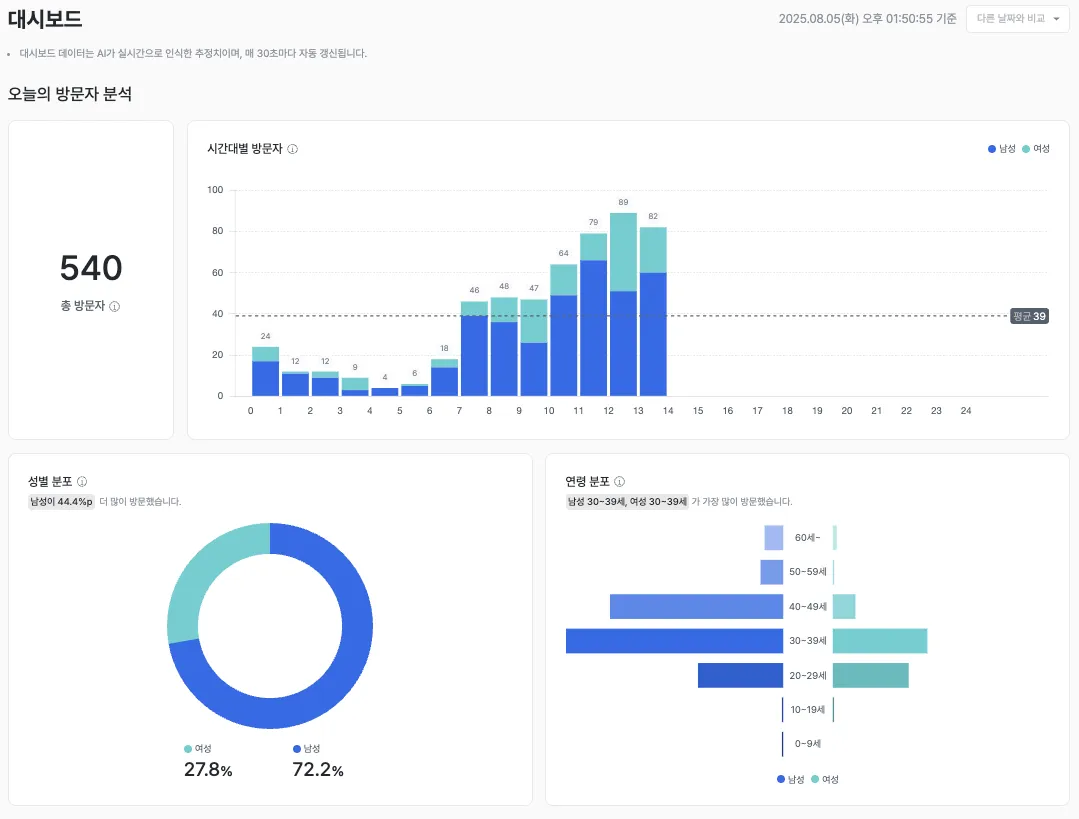
3. Today’s visitor analysis
3.1 Total visitors
- Description: Provides the cumulative visitor count for today.
- Use cases: Compare daily inflow and measure the impact of special events.
3.2 Hourly visitor graph
- Description: Charts how the number of visitors changes by hour throughout the day.
- Use cases: Identify peak hours and optimize shift scheduling.
3.3 Gender and age distribution
- Description: Visualizes the gender and age distribution of visitors in charts.
- Use cases: Run customer segment analysis and build targeted marketing strategies.
4. Tips
- Use filters actively: Use the gender and age filters to easily uncover the behavioral patterns of specific customer groups.
- Compare real-time and cumulative data: Reviewing both real-time status and cumulative data together gives you a more accurate read on the floor.
- Tie in events and promotions: Compare a specific event’s time window against visitor trends to evaluate impact.
Screen layout
Real-time monitoring
Today’s statistics
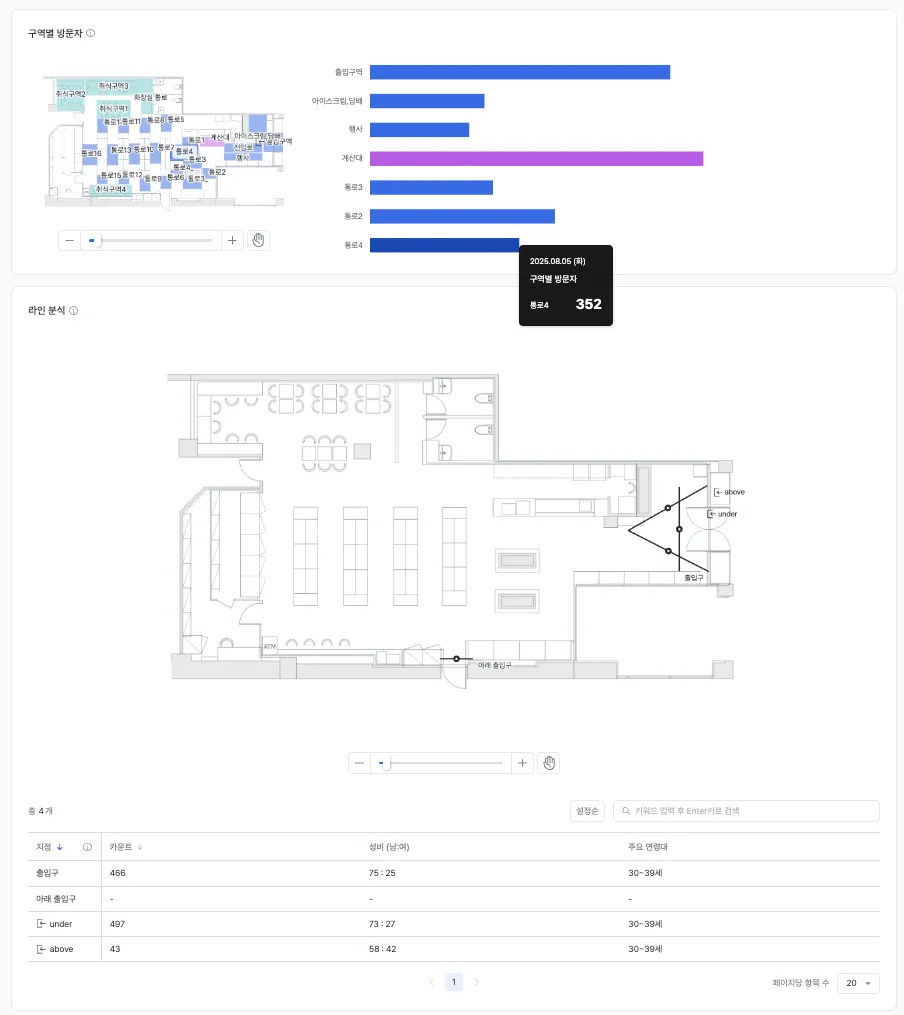
Visitor distribution