Seat Occupancy
Prerequisites
- A seating zone must be defined under Zone settings.
Report layout
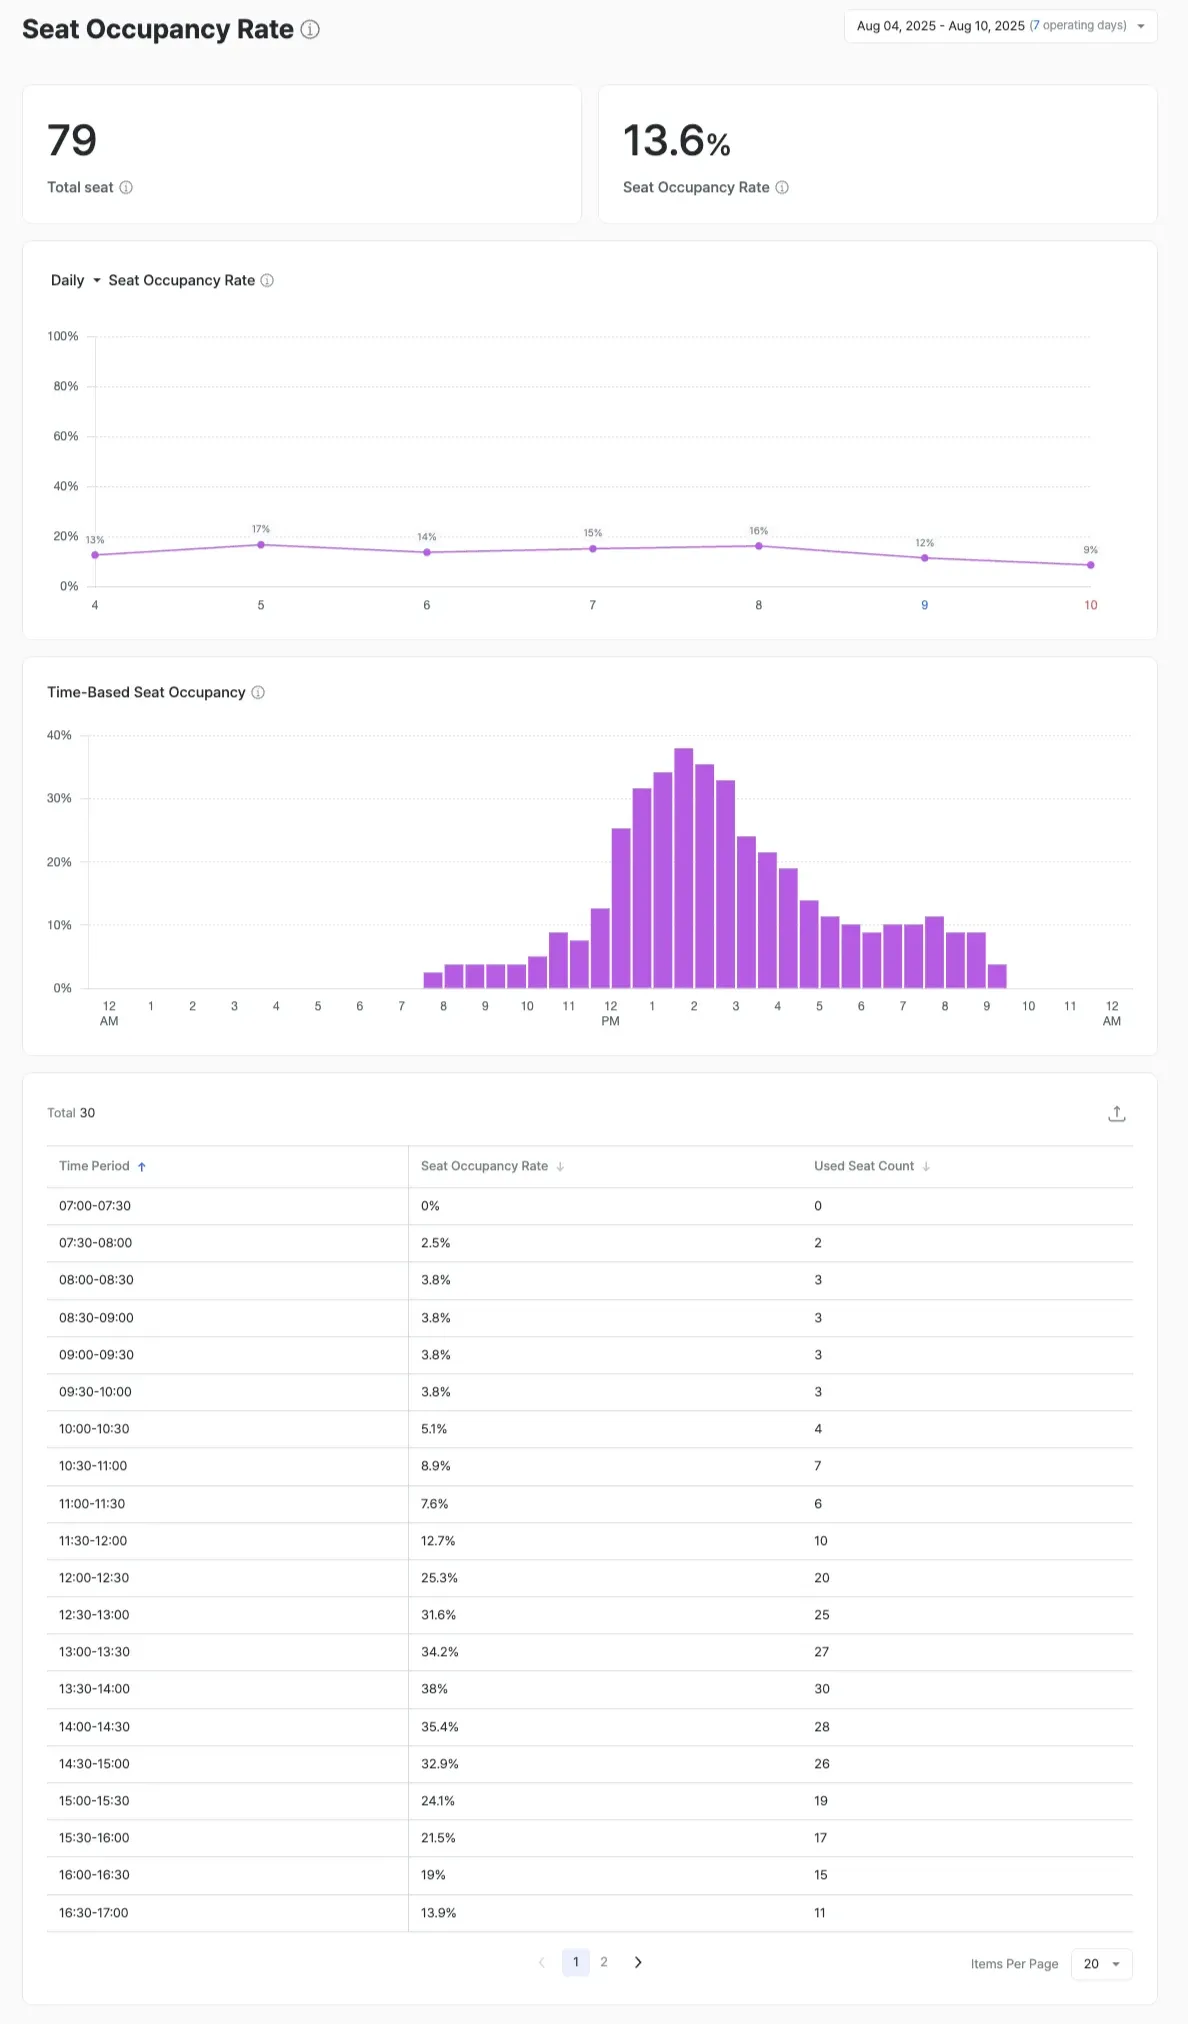
The Seat Occupancy report analyzes when seating across the store is most crowded and how operational and sales tactics at those moments can lift revenue and staff efficiency.
Today, table detection isn’t supported, so only seat-level occupancy is reported. Table-level occupancy that accounts for table movement is planned for a future release.
Analytical view
- Peak-time analysis: Identify the hours when total seating reaches maximum occupancy.
- Seat utilization strategy: Manage turnover and minimize wait times during congested hours.
- Per-table efficiency analysis (planned)
- Diagnose the appropriateness of 1-seat / 2-seat / 4-seat table mixes
- Measure the average number of people seated per table
- Adjust table size relative to crowd composition
Features and data definitions
- Per-seat occupancy: The percentage of time a seat was used during a given period.
- Time-of-day occupancy patterns: Visualize peak vs. off-peak hours by day, week, and month.
- Customer-attribute analysis: Seat-usage rate and average dwell time by gender and age group.
- Table-mix analysis (F&B use cases)
- Improve seat efficiency using table-occupancy data from F&B operations such as Tous Les Jours and Lotteria.
- Surface re-arrangement strategies that secure more dwell capacity during peak hours.
Expected outcomes
- Maximize space efficiency: Re-arrange low-occupancy zones; lift turnover for popular seats
- Optimize operations: Align staffing and serving paths with peak times
- Increase revenue: Lift seated capacity and turnover-driven revenue through layout changes and turnover management
- Improve customer experience: Shorten waits during congestion and provide more comfortable seating
Use cases
- Turnover improvement — When average dwell rises during a lunch peak, refine the menu and payment flow.
- Seat re-arrangement — Inspect the environment around low-occupancy seat locations.
- Staff scheduling — Align staffing with occupancy trends.
- Revenue correlation — Combine with sales data to diagnose seat-efficiency vs. revenue.
- Heatmap visualization — Visualize popular and unpopular seating areas to inform layout improvements.
- Before / after comparison — Compare seat- and table-level occupancy before and after re-arrangements or interior changes.