Visitor analysis
Visitor analysis lets you see your customer base at a glance by analyzing the count, gender, age, and dwell time of customers who visit your store. You can intuitively review daily, weekly, and monthly visitor flow, hourly visitor trends, and your core customer segments to inform strategic decisions.
Report layout
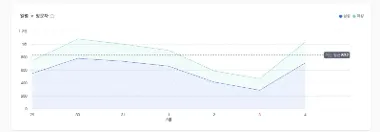
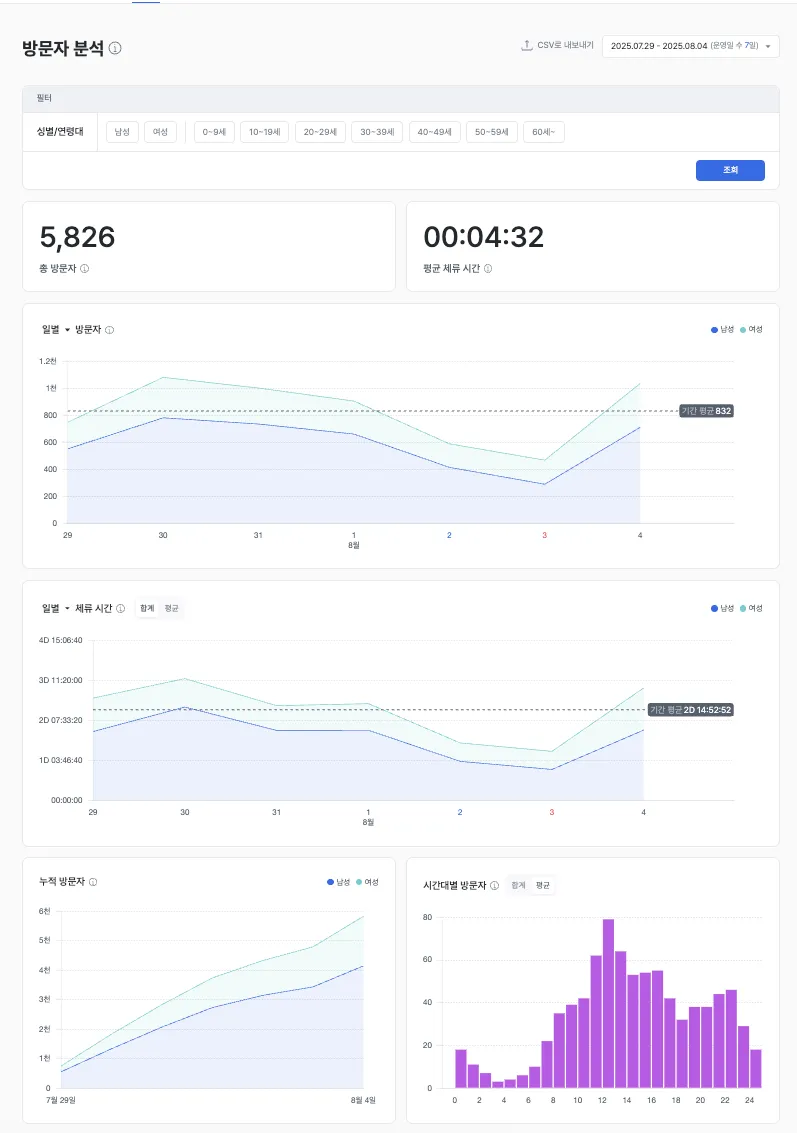
Visitor count by period
- A graph shows the trend in the number of visitors to your store across the period you choose.
- You can set the period to day, week, month, quarter, year, and more.
Examples
- Analyze visitor patterns by day of week and time of day to optimize staffing and plan peak-time strategies.
- Identify shifts in demand driven by seasonality or events.
- Measure changes in visitor count before and after a campaign.
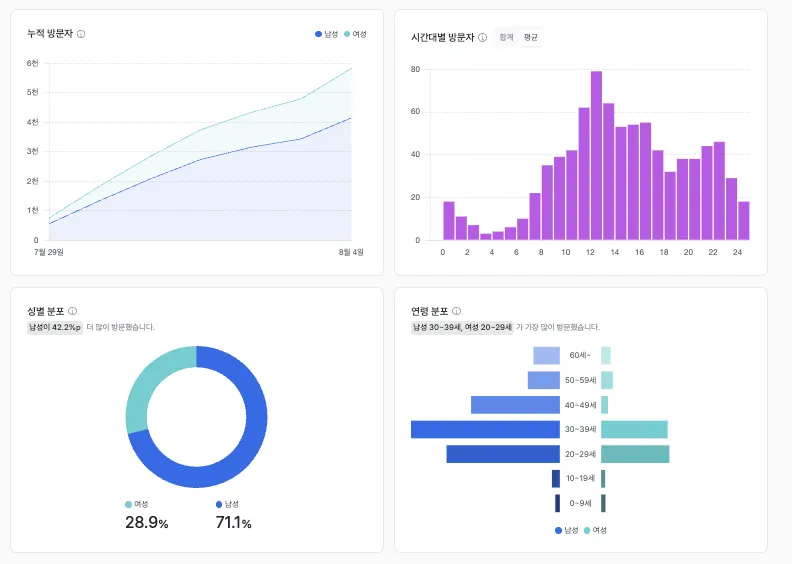
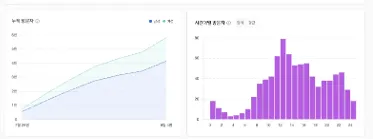
Gender and age analysis
- The gender and age-group distribution of all visitors is visualized for you.
- You can identify the gender and age groups that make up your core customer base.
Examples
- Define your primary customer segments and design strategies tailored to those targets.
- If visitors skew toward a specific gender or age group, design strategies that draw a more balanced audience.
- Understand customer characteristics by time of day to design tailored strategies.
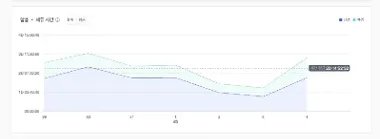
Average dwell time
- Analyze the average time a single customer spends in the store.
- This is an indirect measure of in-store interest and engagement.
Examples
- If dwell time is short, diagnose and improve the appeal of your store layout or merchandise.
- Analyze whether longer dwell time translates into higher sales.
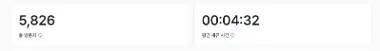
Key metrics (KPIs)
| Metric | Description | Actionable insight |
|---|---|---|
| Total visitors | Total unique visitors to the store within the selected period | Confirm the store’s pulling power and the immediate impact of marketing activity |
| Average dwell time | Average time spent in the store per customer | Evaluate the appeal of merchandise, content, and the space itself |
| Gender / age distribution | Share of visitors by gender and age group | Segment target customers and design tailored products and services |
| Hourly density | Variation in customer inflow by hour | Establish a baseline for staffing and crowd management |
Expected outcomes
Long-term trend forecasting
- Identify customer trends from monthly and yearly data.
- Forecast seasonal demand and act on strategic plans early.
Marketing validation
- Quantify changes in visitor count and dwell time before and after campaigns.
- Objectively validate marketing performance and produce more credible reports.
Operations optimization
- Identify peak times and low-traffic hours from visitor flow.
- Refine staffing, top-merchandise placement, and inventory replenishment timing.
Use cases
- Visitor target definition — Update your store’s target persona based on the most frequent age and gender combinations.
- Promotion measurement — Compare visitor counts before and after a campaign.
- Staffing strategy — Adjust staff schedules to match peaks by day of week and time of day.
Advanced tips
Pure growth-rate analysis
- Compare against the same period last year or last month to remove seasonal effects and reveal underlying changes.
- Use this view to diagnose your store’s long-term growth.
Behavior comparison by customer segment
- Compare in detail how target customer groups behave in the store (dwell time, visit frequency).
- You can combine segments such as “weekday-visiting women in their 30s” or “weekend-evening men in their 40s.”
Promotion and campaign correlation
- Compare visitor counts and dwell times in the periods immediately before and after a promotion or campaign.
- Objectively measure the precise return on resources you invest.