Representative path
Representative path analysis is a core feature that automatically extracts the main route (the superhighway) most customers actually follow from the many movement trajectories in your store.
This route visually shows the “spatial flow with the highest exposure” in the store, and it becomes a strategic anchor for merchandising, promotions, and store path design.
Report layout
Automatic core-path extraction
- Among customer movement logs, the single most frequently traveled route is visualized on the map.
- You can intuitively understand the traffic frequency and direction of this route.
Examples
- Concentrate new and flagship merchandise on the core route to maximize exposure.
- Concentrate marketing resources — POP, promotions — around the core path to maximize ROI.
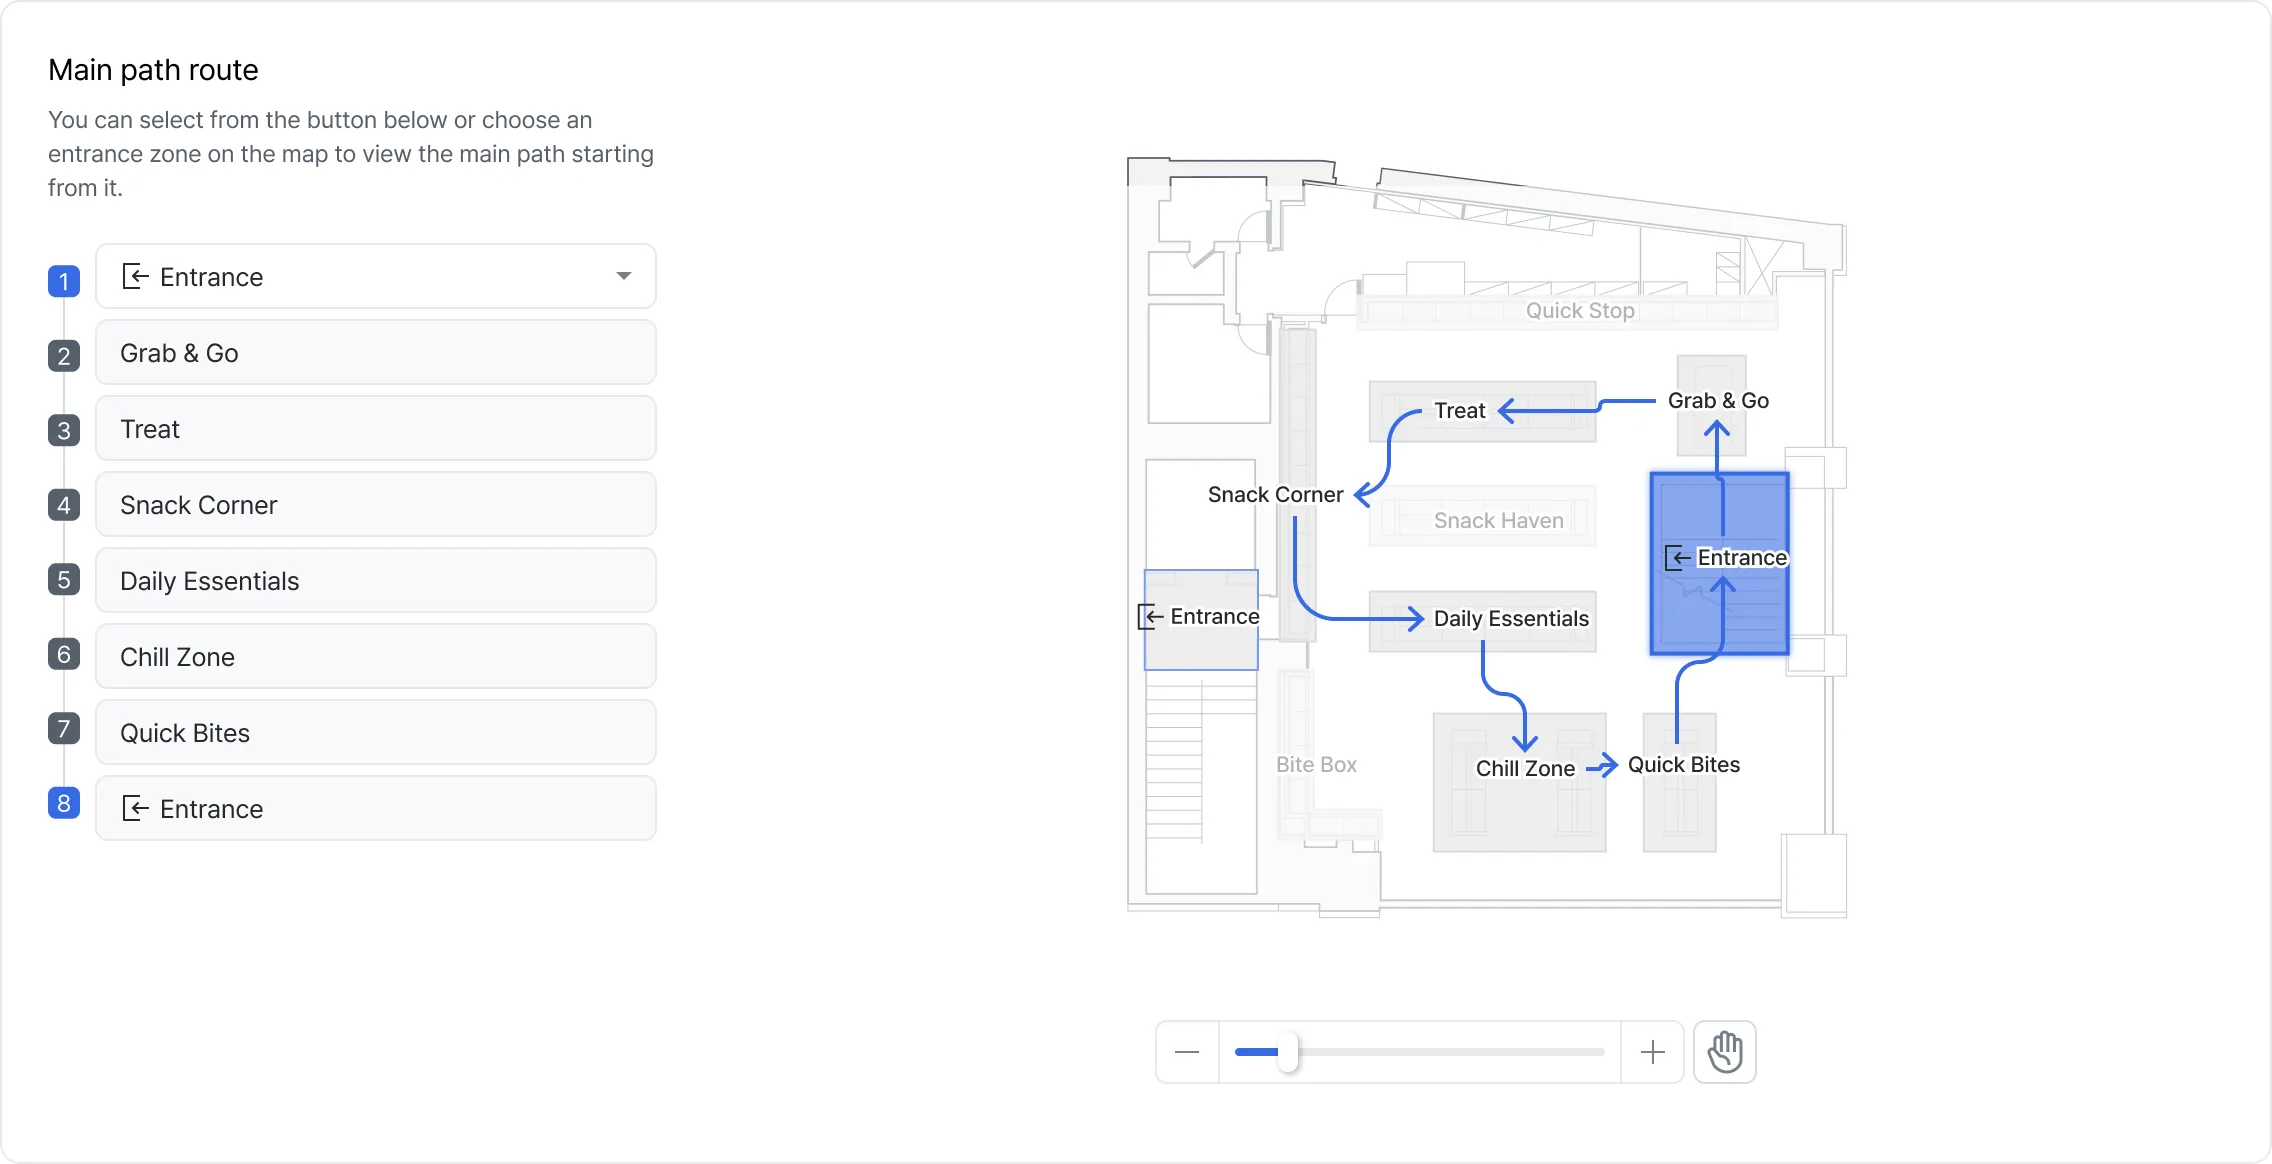
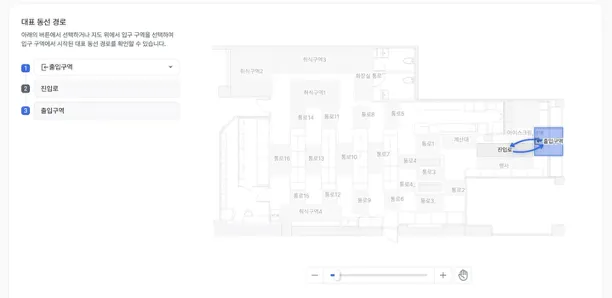
Set an origin and view the representative-path sequence
- Select an entrance zone from the map or list to extract the representative path that starts from that zone.
- The extracted path is provided as an ordered sequence so you can step through the zones the customer traveled.
Examples
- Understand the customer purpose and movement pattern by entrance type (front entrance, subway-connected entrance, etc.).
- Design merchandise / VMD strategies separately by entrance (for example, F&B-led vs. fashion-led) for higher efficiency.
Filter-based representative-path analysis
- Filter the representative path by gender, age group, dwell time, and other customer attributes for tailored analysis.
- Identify the paths a specific target customer group actually prefers.
Examples
- Reinforce related-product displays along the representative path of “women in their 20s” (color cosmetics → SPA brand → dessert café).
- Strengthen impulse-purchase displays around the path of “quick-purchase (under-five-minute dwell)” customers (entrance → essentials → checkout).

Use cases
Sharper merchandising
- Place core merchandise on the data-driven representative path to maximize sales efficiency.
- Validate whether placement of related products translates into actual customer flow, securing core evidence for layout design.
Crowd and bottleneck response
- Identify the spots where representative paths concentrate to predict congestion in advance and design operations.
- Resolve congestion at concentrated points so that customer flow stays smooth and shopping satisfaction increases.
Marketing and resource concentration
- Optimize the placement of marketing resources — ads, POP, events — along the representative path with the largest exposure.
- When inflow into a zone is low, use this as strategic evidence for improving accessibility or repurposing the zone.
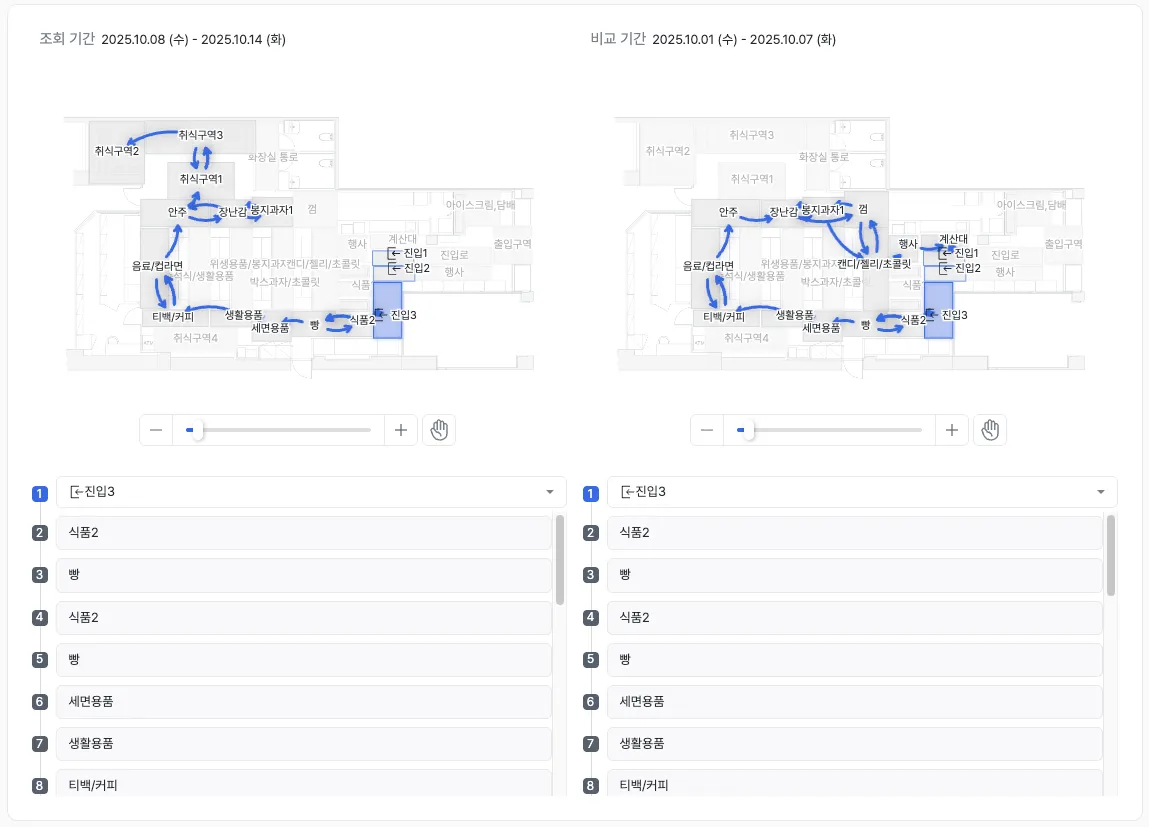
Before-and-after comparison
- Period comparison — Compare representative paths before and after store renewals, VMD changes, or promotions side by side to visually validate effectiveness.
- Filter comparison — Compare representative paths between target customer groups (men vs. women, 20s vs. 40s) to set the direction of tailored strategies.
Combined analytics workflow
Representative path analysis works on its own, but synergy grows when combined with other reports. We recommend combining the analyses in this order.
- Identify the representative path — Use representative path analysis to derive the most-traveled route.
- Confirm segment movement and drop-off — Use Inter-zone traffic to verify movement rate and inefficient drop-off rate between segments of the path.
- Evaluate zone performance along the path — Use Zone Interest Analysis to judge whether each zone on the path attracts customer interest (Hot) or has relatively low attention (Cold).
- Validate sales contribution — Use Purchase conversion rate to compare purchase rates between customers who follow the representative path and those who do not, confirming the strategy’s effectiveness.
Advanced filter usage
- Compare the representative paths of “quick-purchase (under-five-minute dwell)” customers and “browsers (over-ten-minute dwell)” to design merchandise placement optimized for each group.
- Compare the representative paths of your primary target customers with those of non-primary targets to find ways to attract the non-primary group.