Zone analysis
Zone analysis breaks your store into zones to analyze where customers spend time and where they show interest. With data on inflow, dwell, interest, and demographics by zone, you can optimize store layout and merchandising strategies with data.
For zone definitions, see the Zone settings guide.
Report layout
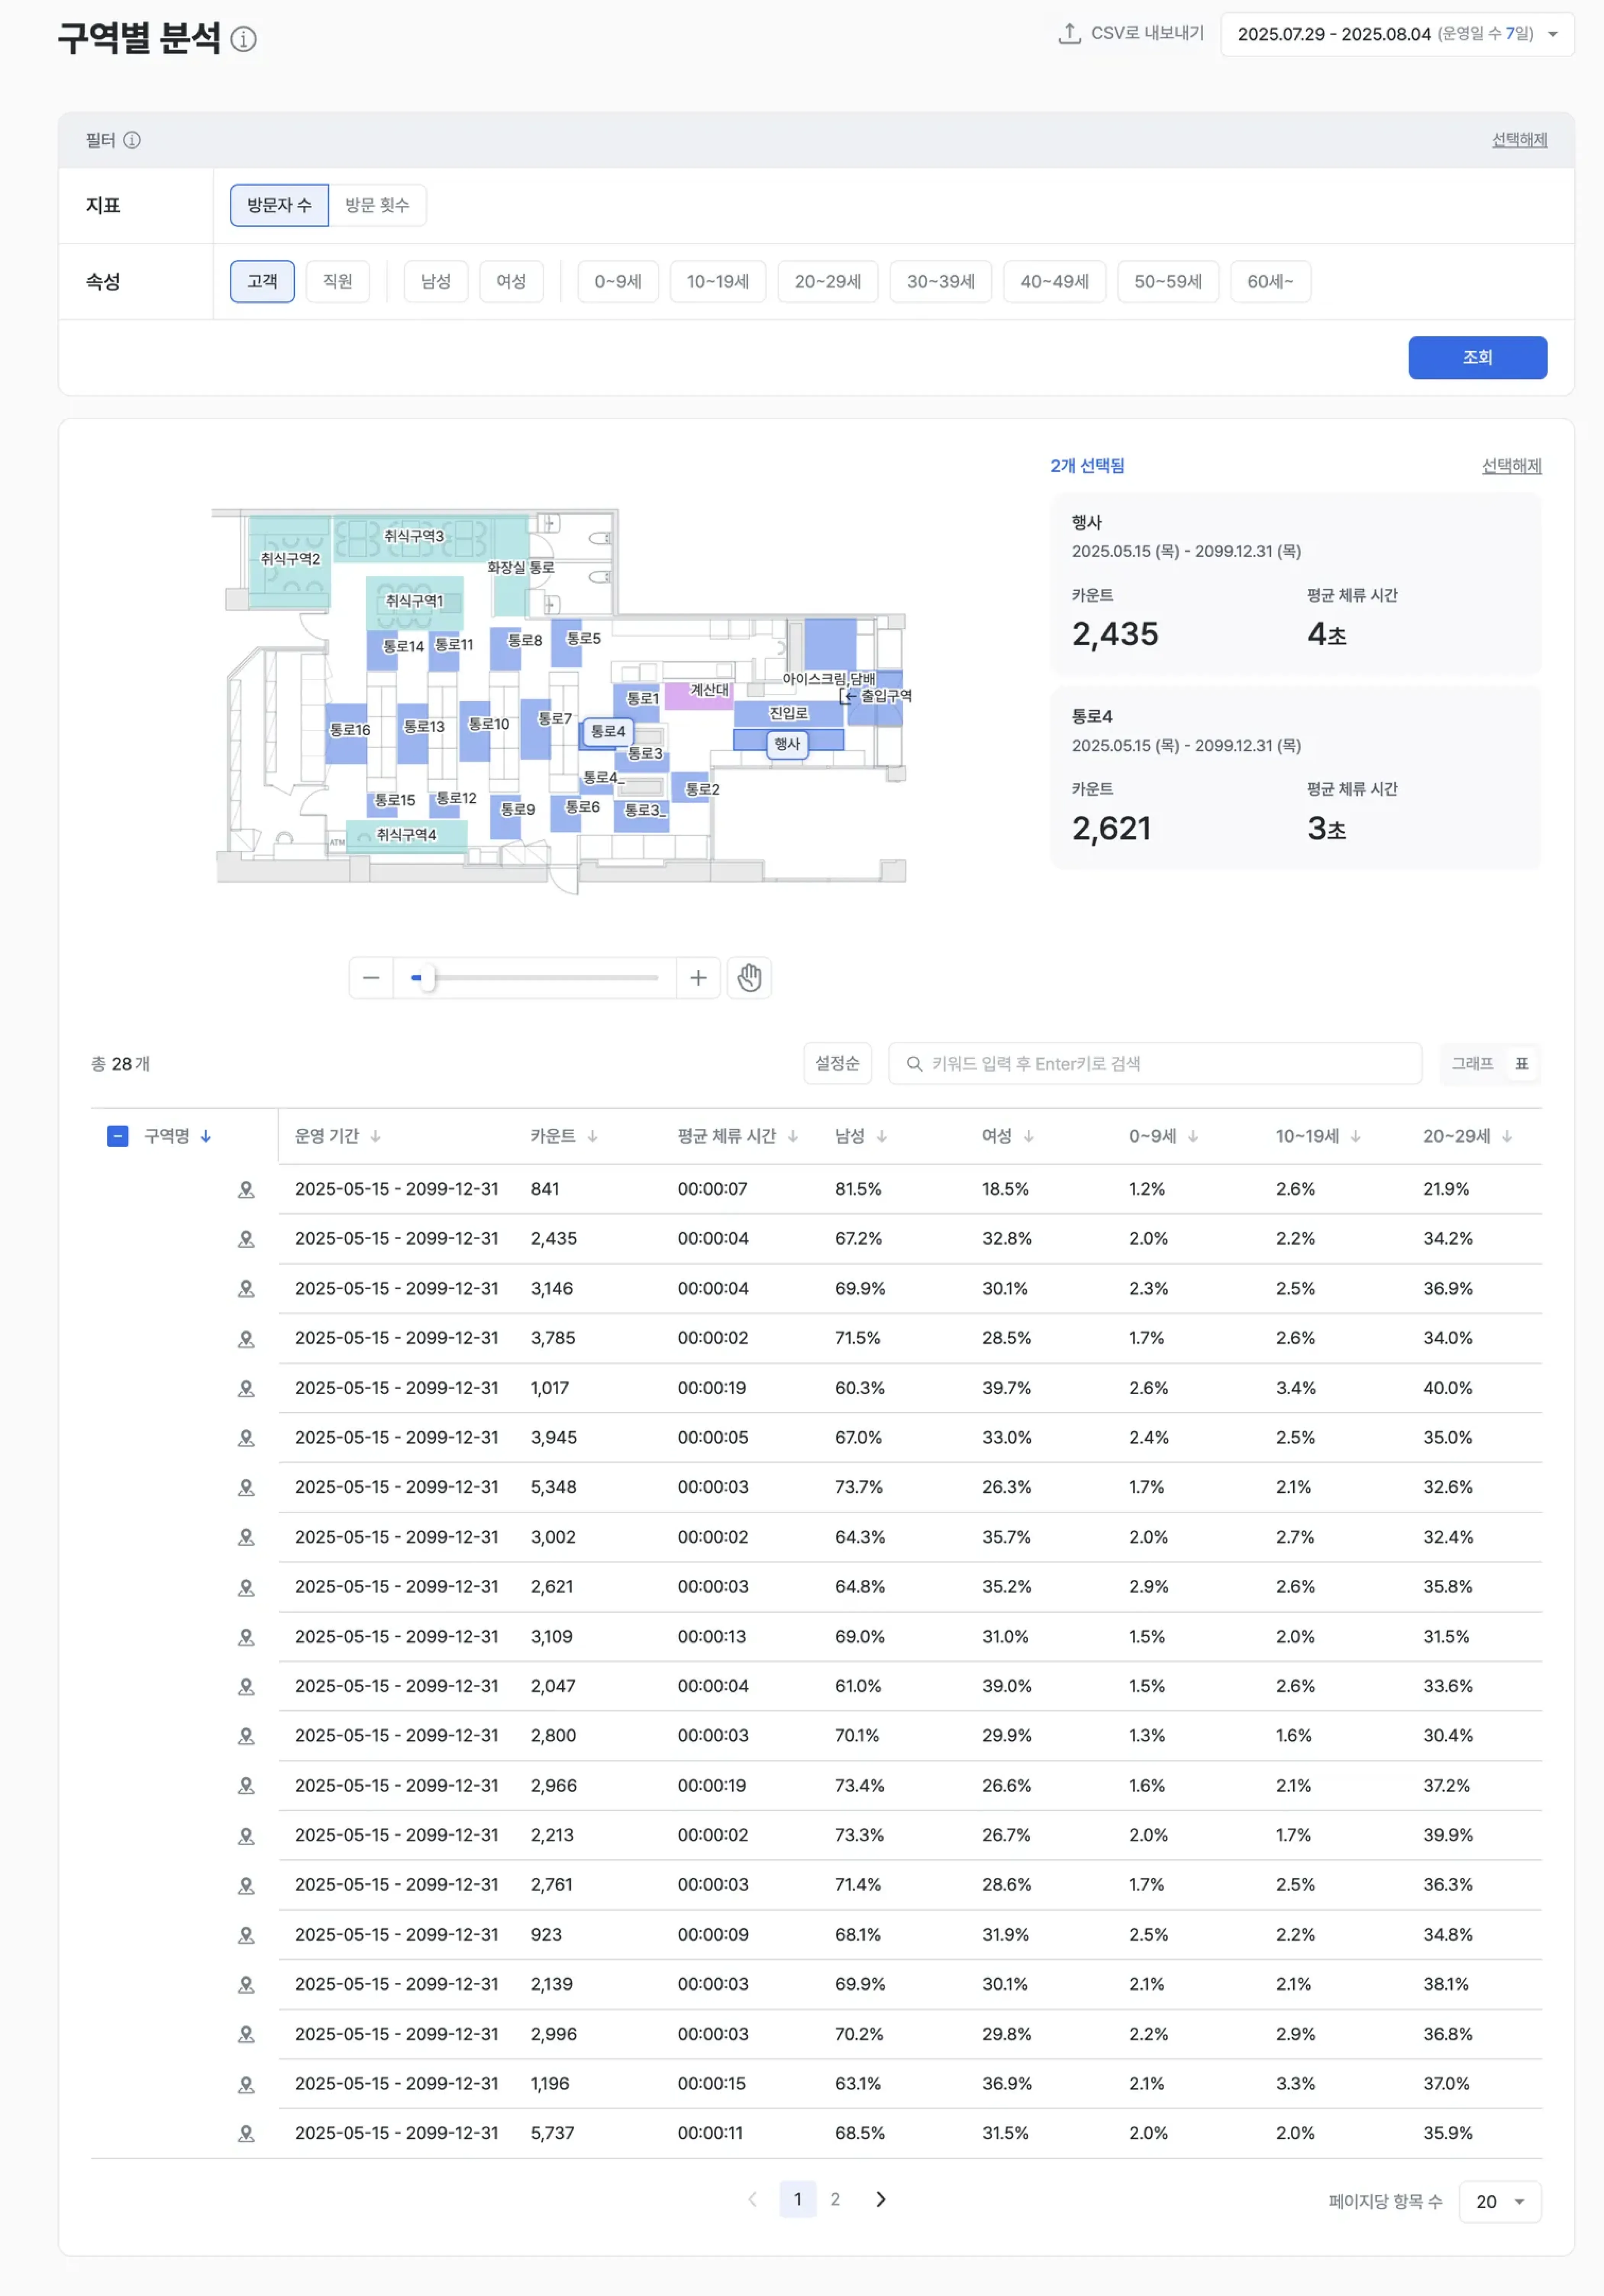
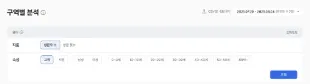
Zone setup
- Draw zones freely on the store floor plan (polygon, circle, and more).
- You can split the store by various criteria — product category, function, brand, and so on.
Examples
- Split the store into a new-arrivals zone, an event zone, and a checkout-queue zone to compare performance by space.
- Analyze customer response in a specific brand zone and measure promotion effectiveness.
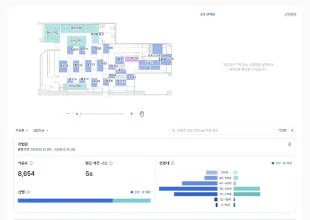
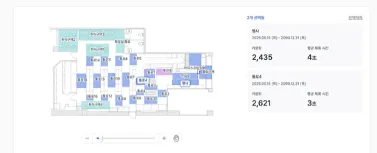
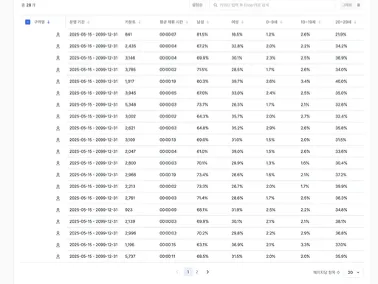
Visitor count and dwell time
- Inflow (visitor count) and average dwell time are automatically aggregated for each zone.
- Use a dwell-time filter (for example, three seconds or longer) to focus on customers who stayed beyond a specific threshold.
Examples
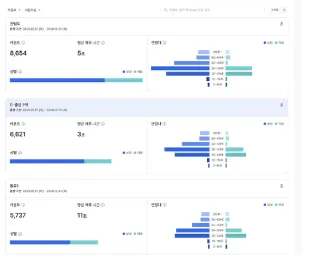
- Compare visitor count with average dwell time to judge the substantive appeal of each zone.
- Improve displays in zones with low dwell time and measure the change.
- Use visitor counts to evaluate whether staffing and resource investment are appropriate.
Demographics by zone
- The system automatically analyzes the gender and age-group distribution of customers in each zone.
- You can filter the data by customer attributes such as gender and age.
Examples
- Filter the data by customer attributes such as gender and age to view results.
- Use dwell-time analysis by customer group to prioritize which segments to improve for or focus marketing on.
- Design target-tailored advertising and in-store signage strategies.
Key metrics (KPIs)
| Metric | Description | Insight |
|---|---|---|
| Visitors per zone | Customers entering the zone | Confirm the zone’s popularity (pulling power) |
| Average dwell time | Average time customers spend in the zone | Evaluate interest level and the appeal of the space |
| Visit density | How densely customers are gathered | See hot and cold zones at a glance (heatmap visualization) |
| Demographics per zone | Gender and age-group distribution | Understand zone preferences by customer group |
| Zone visit rate | Share of all customers who visit this zone | Diagnose accessibility and zone reach |
| Bounce rate | Share of customers who leave a zone immediately after entering | Diagnose first impressions and product fit |
Expected outcomes
Space optimization
- Design more efficient store layouts based on customer paths and dwell data.
- Maintain or strengthen hot zones and improve cold zones.
Target marketing
- Identify the zones each customer group prefers and run accurate target promotions.
- Differentiate advertising and display content by zone.
Operational improvement
- Identify peak times and zones to optimize staffing and inventory placement.
- Improve bottleneck or drop-off zones to make shopping easier.
Use cases
- Hot / cold zone diagnosis — See at a glance which zones draw customers and which sit empty.
- Merchandise rearrangement — Reconsider the location and exposure of products placed in cold zones.
- Target marketing — Use the visitor profiles of popular zones to design campaign messages.
Advanced tips
Deep dive into core zones
- Closely analyze the customer profile and dwell behavior in zones with high revenue contribution.
- Generate additional results through related-merchandise display, lighting, and content reinforcement.
Improving underperforming zones
- Identify the cause of cold zones (location, composition, display, etc.), apply improvements, and validate with data.
- Measure changes in inflow and dwell time after revising VMD, merchandise, or promotions.
Season and event comparison
- Compare seasonal differences in customer response to plan period-specific strategies.
- Compare before and after holidays or events to optimize space and merchandise placement.