Ad Viewing Analysis
Prerequisites
- The ad placement (Attention Target, AT) and Visible Area (VA) must be configured under Ad viewing analysis settings.
Report layout

Ad Viewing Analysis is a tool for quantitatively measuring traffic, viewing count, and viewing rate at specific ad placements configured in the store. It analyzes the share of total passersby who actually viewed the ad. Confirm the actual exposure performance of an ad in numbers — the core tool for optimizing ad placements and content strategy.
Core features
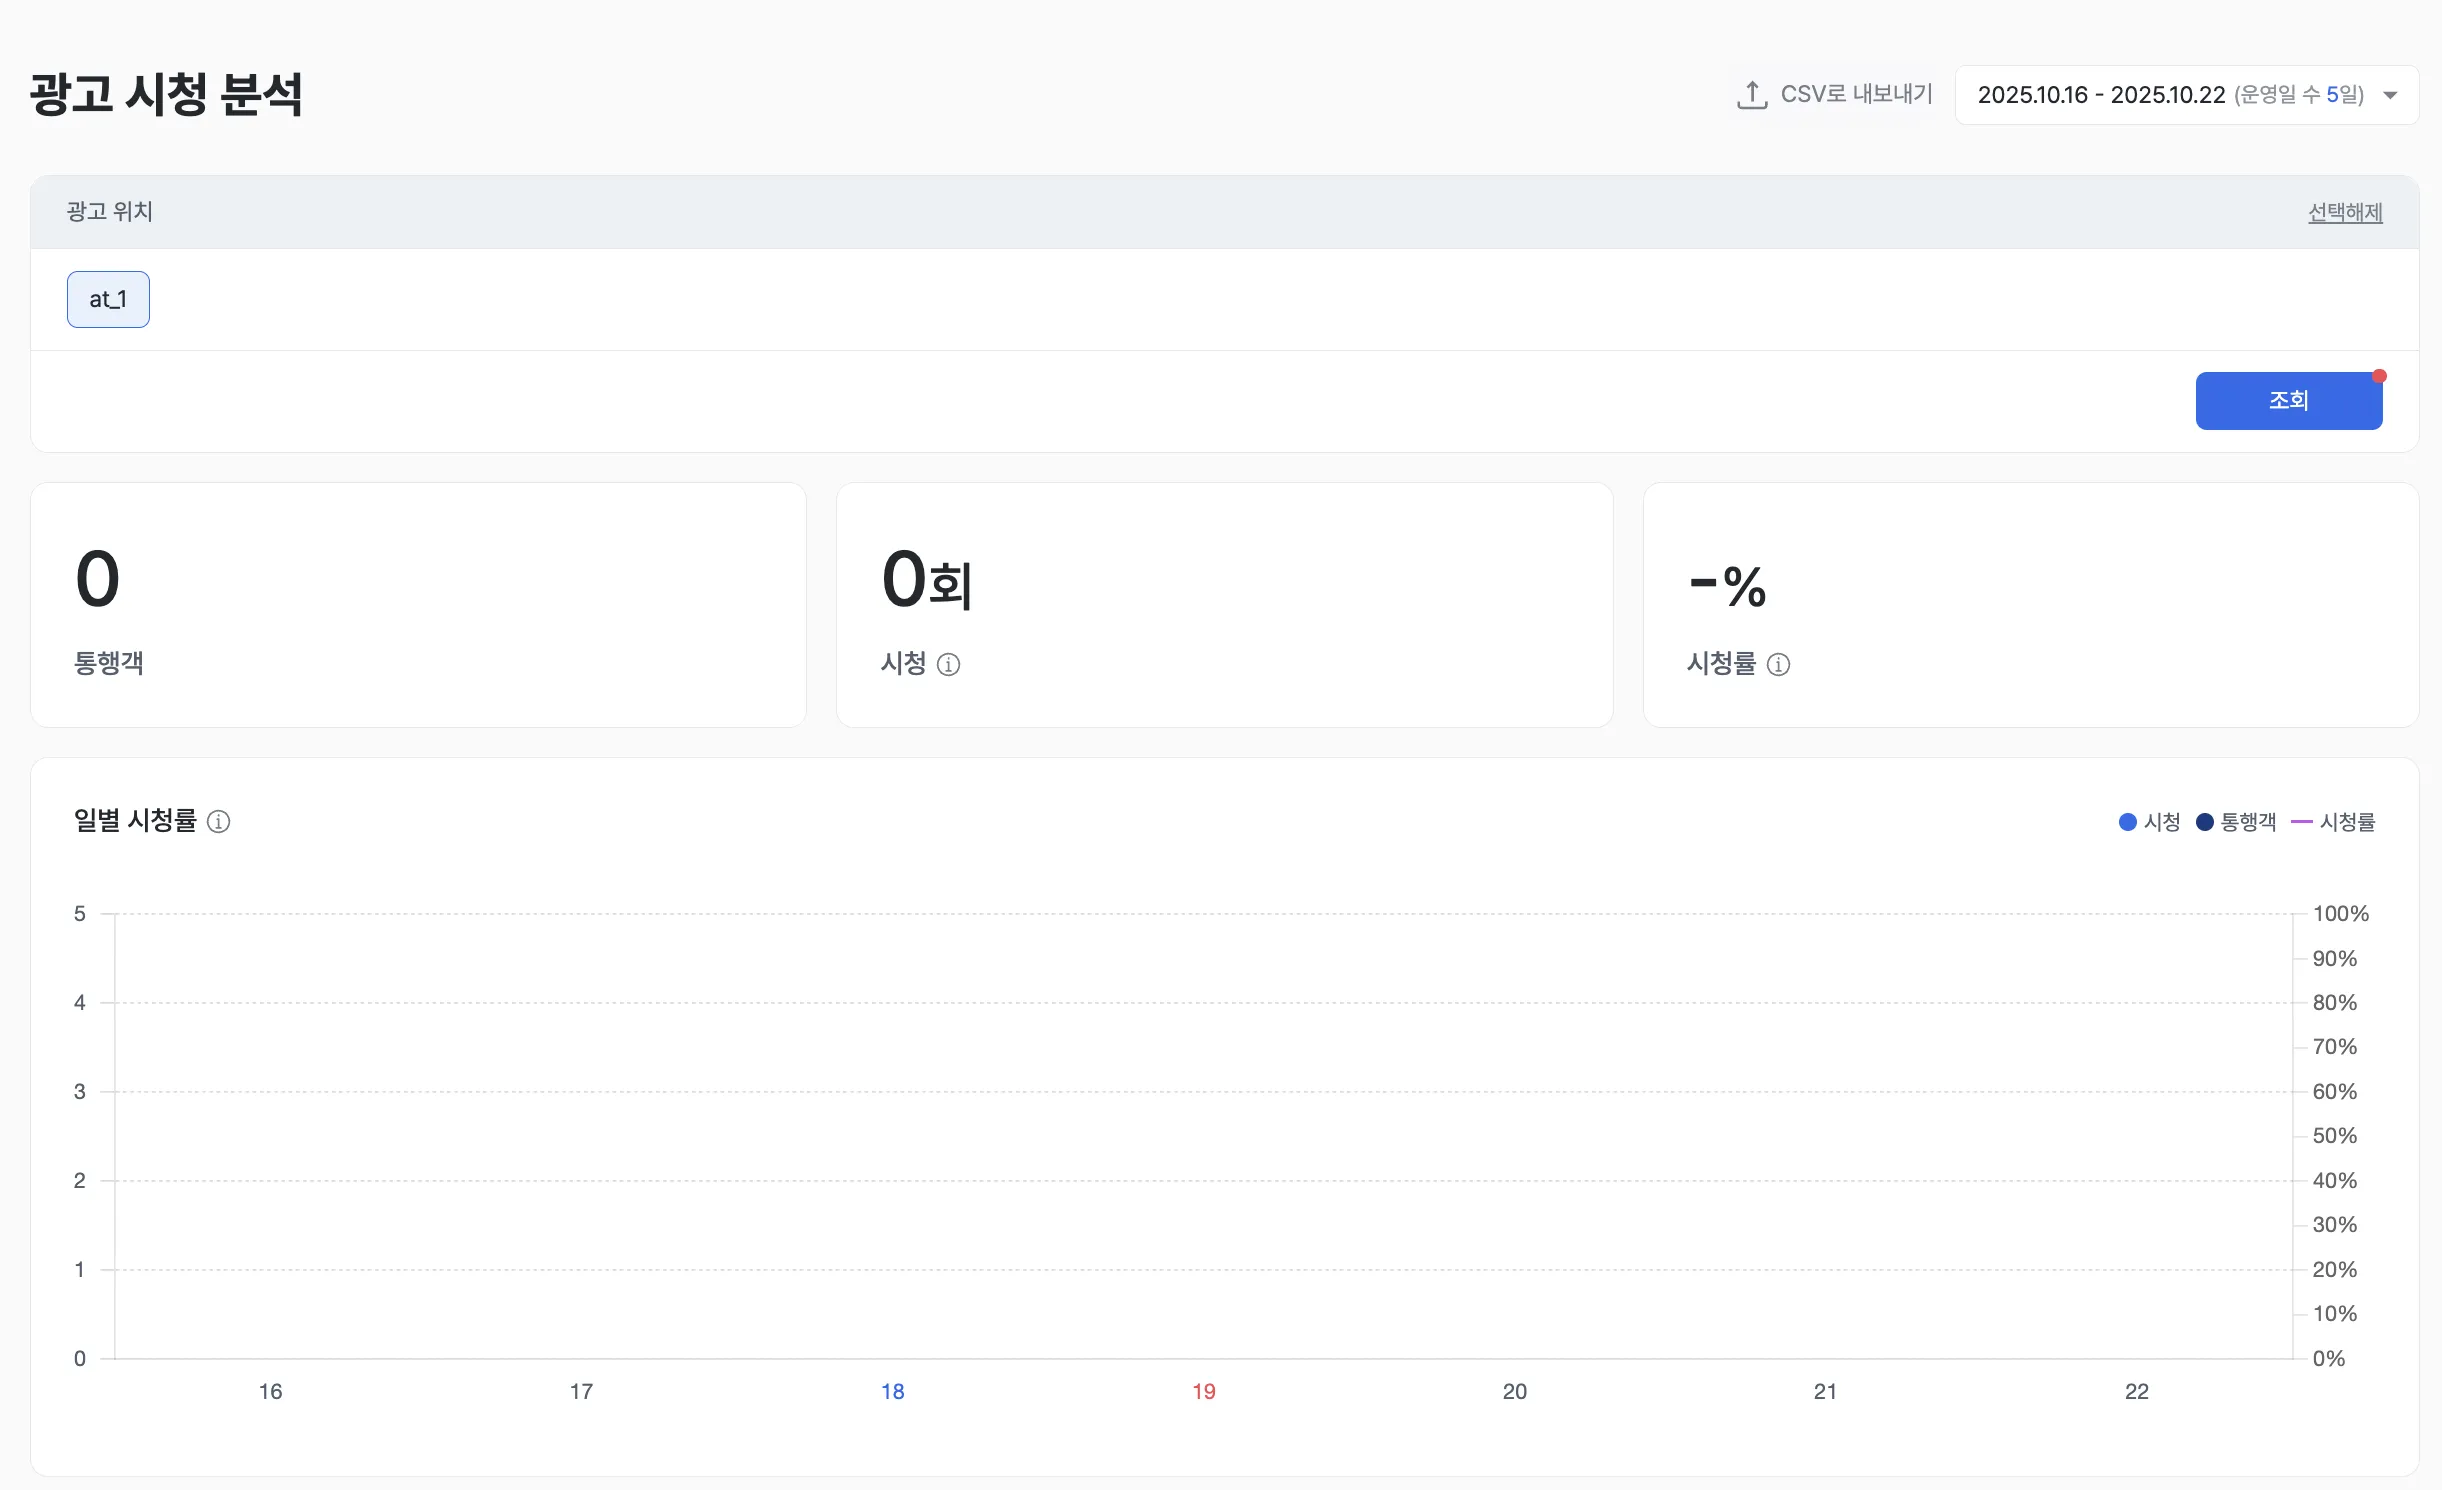
Per-placement core performance
- For the placement selected in the top “Ad placement” filter, the dashboard surfaces traffic count, viewing count, and viewing rate.
- Viewing rate is computed as viewing count divided by total traffic, giving an intuitive read on placement efficiency.
Examples
- Identify ad placements with low viewing rates relative to traffic and prioritize improvements to ad content, lighting, or location.
- Track viewing-rate changes by hour and day to optimize ad airing time and operational schedules.
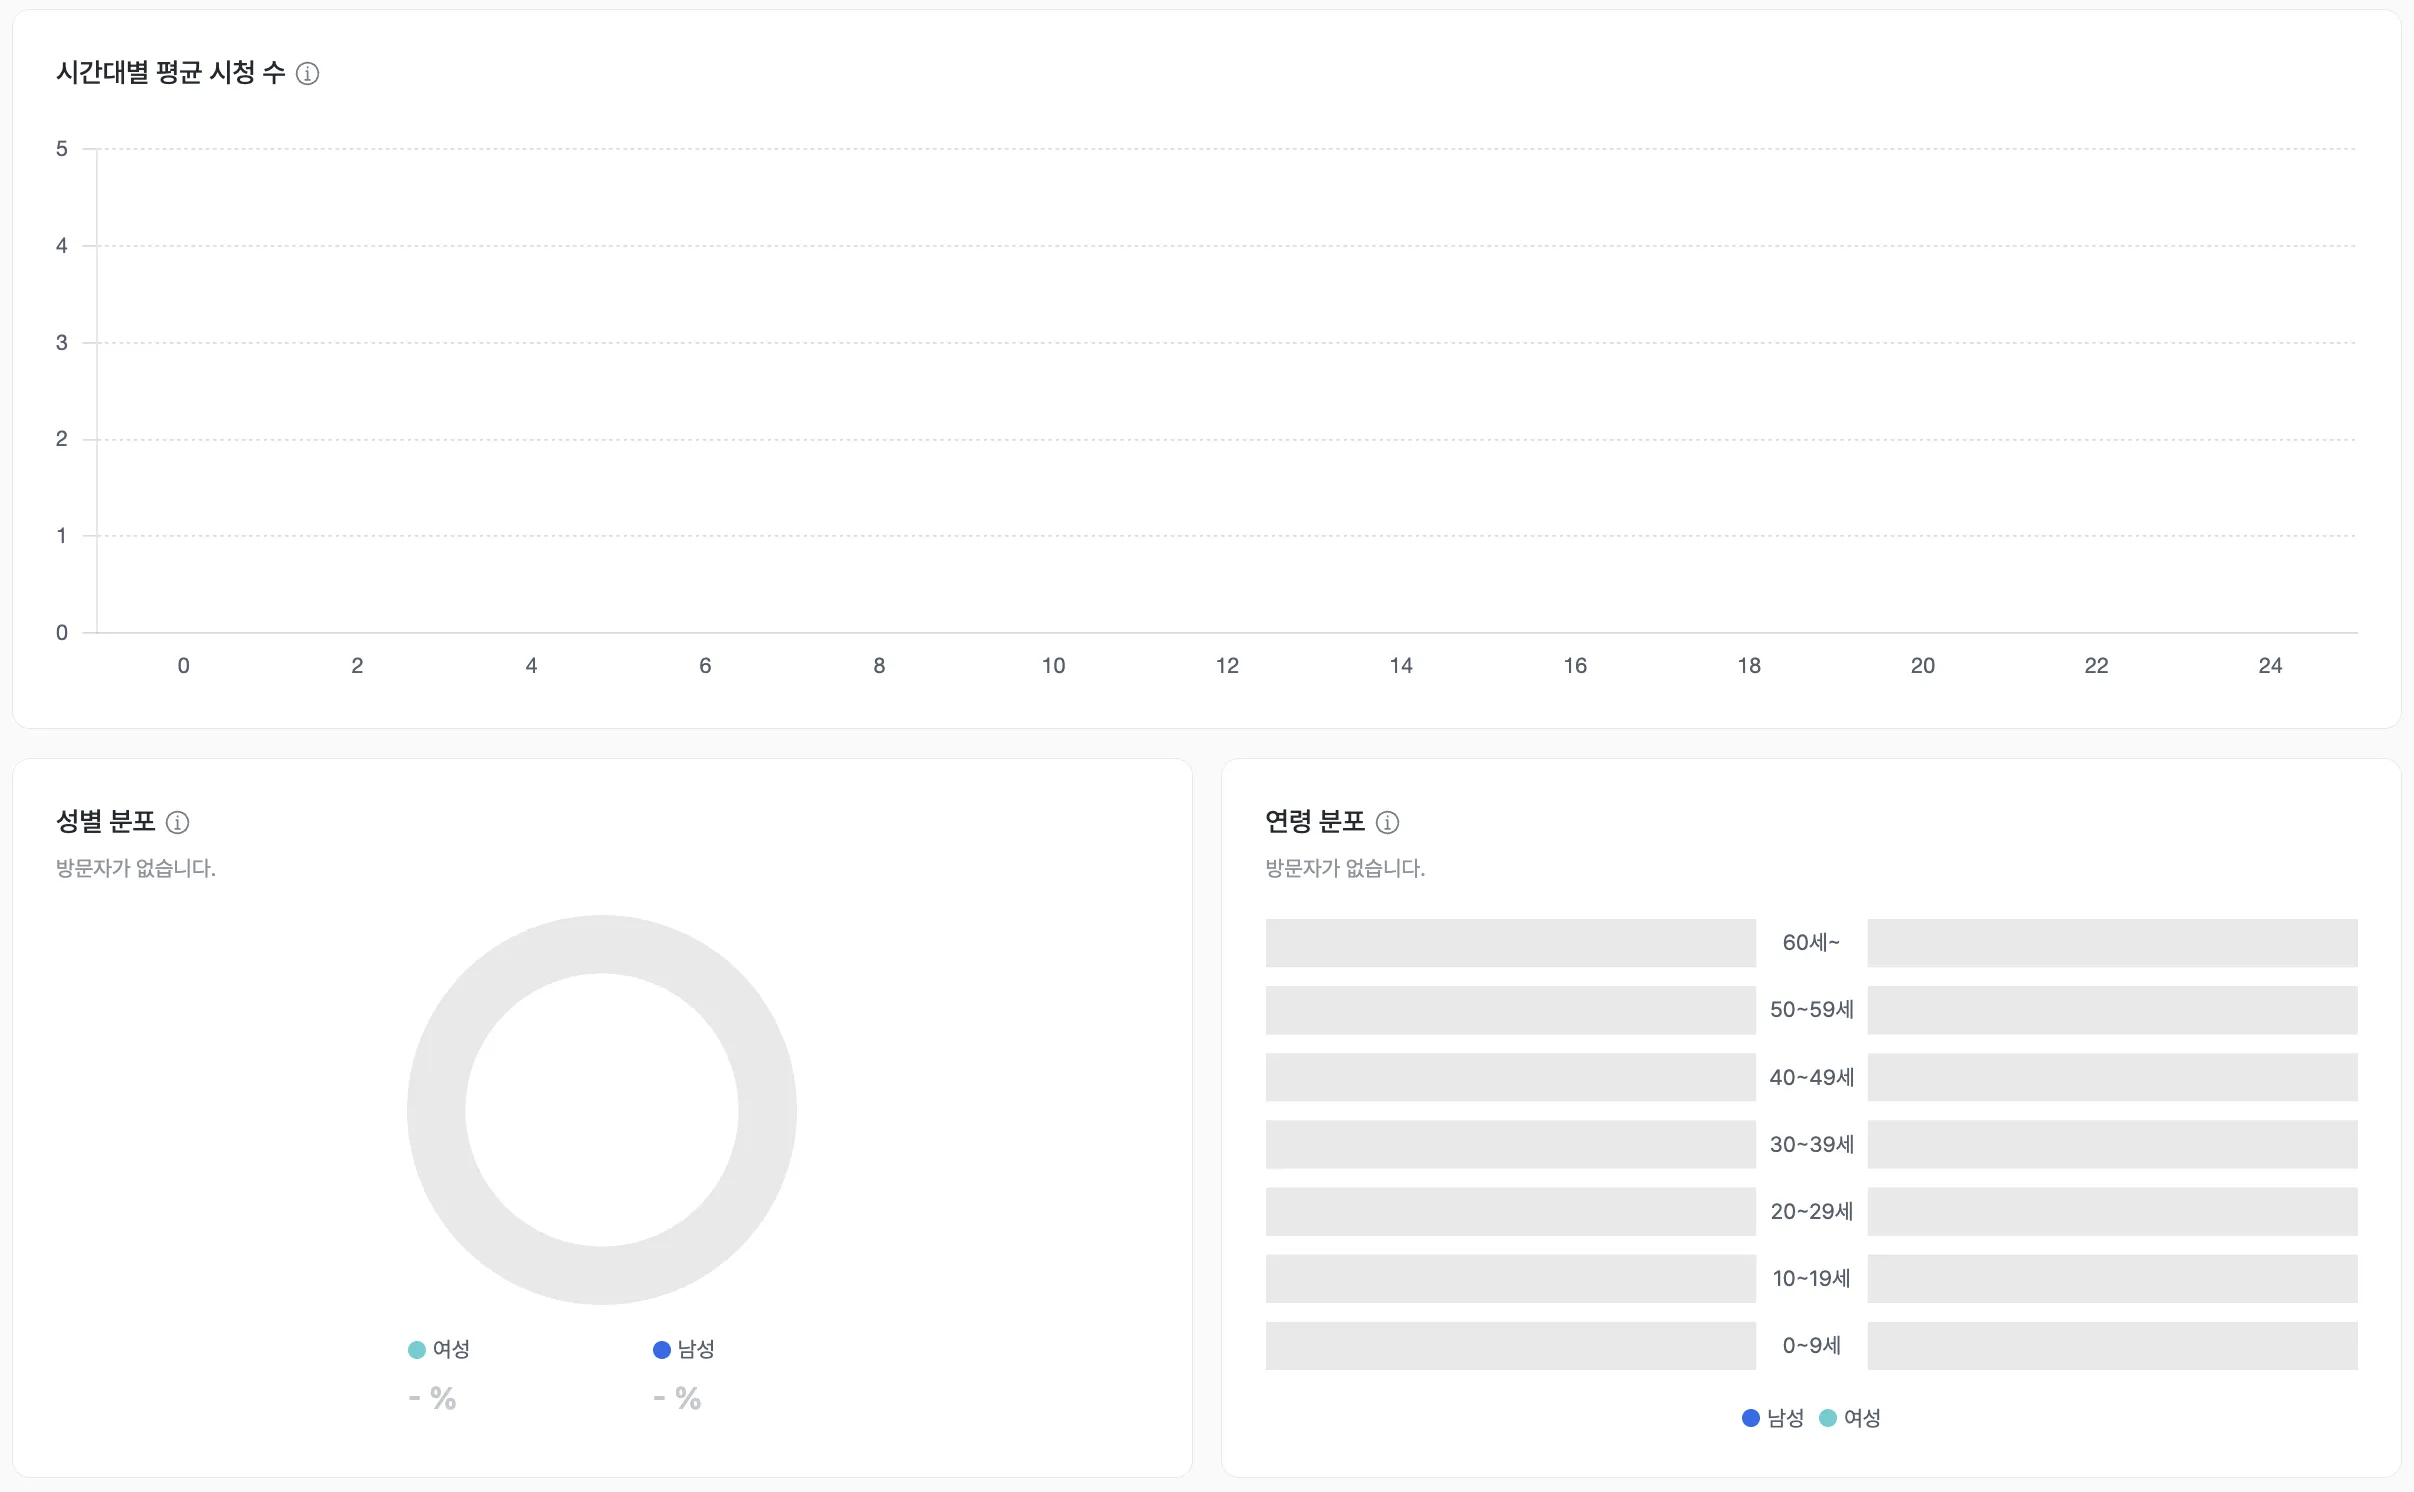
Detailed viewer demographics
- Charts the gender and age-range distribution of both passersby and viewers.
- Quantifies the actual response of target audiences to a specific ad placement.
Examples
- If a particular age group (e.g., 20s) shows a high viewing rate while the target group (e.g., 40s) shows a low one, inspect the content’s fit with the target.
- Compare viewer gender mix across placements to differentiate ad content by location.
Per-placement comparison
- Provides detailed analytics in tabular form for every placement available in the “Ad placement” filter.
- Compare viewing rate, viewer age distribution, and average viewing count by hour to choose the optimal placements.
Examples
- Find the placement with the highest viewing rate and concentrate promotion ads there.
- Compare environmental factors (path flow, surrounding shelves) between high- and low-rate placements to set objective placement-selection criteria.
Key metrics (KPIs)
| Metric | Description | Insight |
|---|---|---|
| Viewing rate | Viewing count ÷ total traffic × 100 | Evaluate exposure performance and customer attention for the placement |
| Viewing count | Total times the ad was viewed | Capacity to draw traffic to the ad content |
| Gender / age distribution | Gender and age-range share of viewers | Confirm target-audience response and content fit |
| Average hourly viewing | Average viewing count by hour for the placement chosen in the “Ad placement” filter | Optimize when to air ads and concentrate operations staff |
Use cases
Quantitatively validate ad-exposure performance
- Measure actual viewing behavior to validate ad-exposure performance with numbers.
- Assess the exposure efficiency of ad content and placements with a clear figure: viewing rate vs. traffic.
Optimize placements and content
- Identify low-rate placements and build the case for improving the environment or moving the ad to a different spot.
- Analyze viewer demographics (gender, age) to deliver target-tailored content for each placement.
Maximize ad-budget efficiency
- Use per-placement performance data to concentrate budget on the most efficient locations and lift marketing ROI.
- Avoid wasting ad budget on low-efficiency placements and clarify resource priorities.
Advanced tips
Summary
Ad Viewing Analysis is the core analysis tool that quantitatively measures the ability of an ad placement to convert customer traffic into actual viewing behavior. Based on traffic, viewing count, and gender / age distribution data, it gives you a clear case for choosing the most efficient placements and content strategy — preventing marketing-budget waste.