Custom Report
Custom Report is a tailored report builder that lets you set your own analytical criteria, filters, and comparison points and visualize them together in a single integrated report.
It’s designed to cut down repetitive reporting work and let practitioners approach data with a clear purpose in mind.
Report layout
Selecting analysis modules
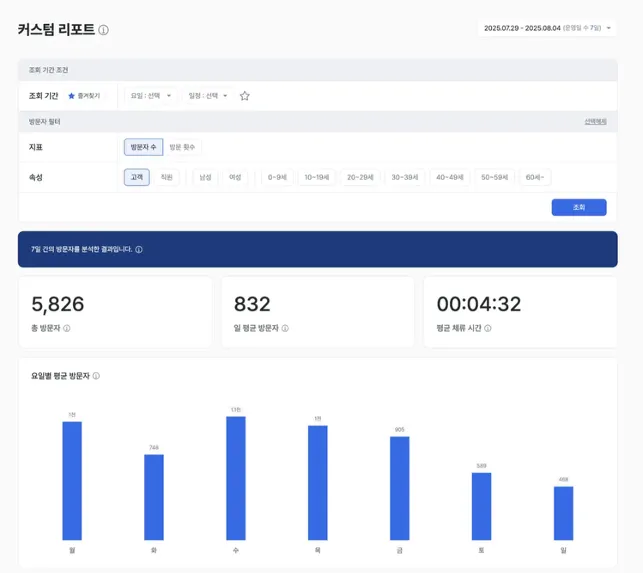
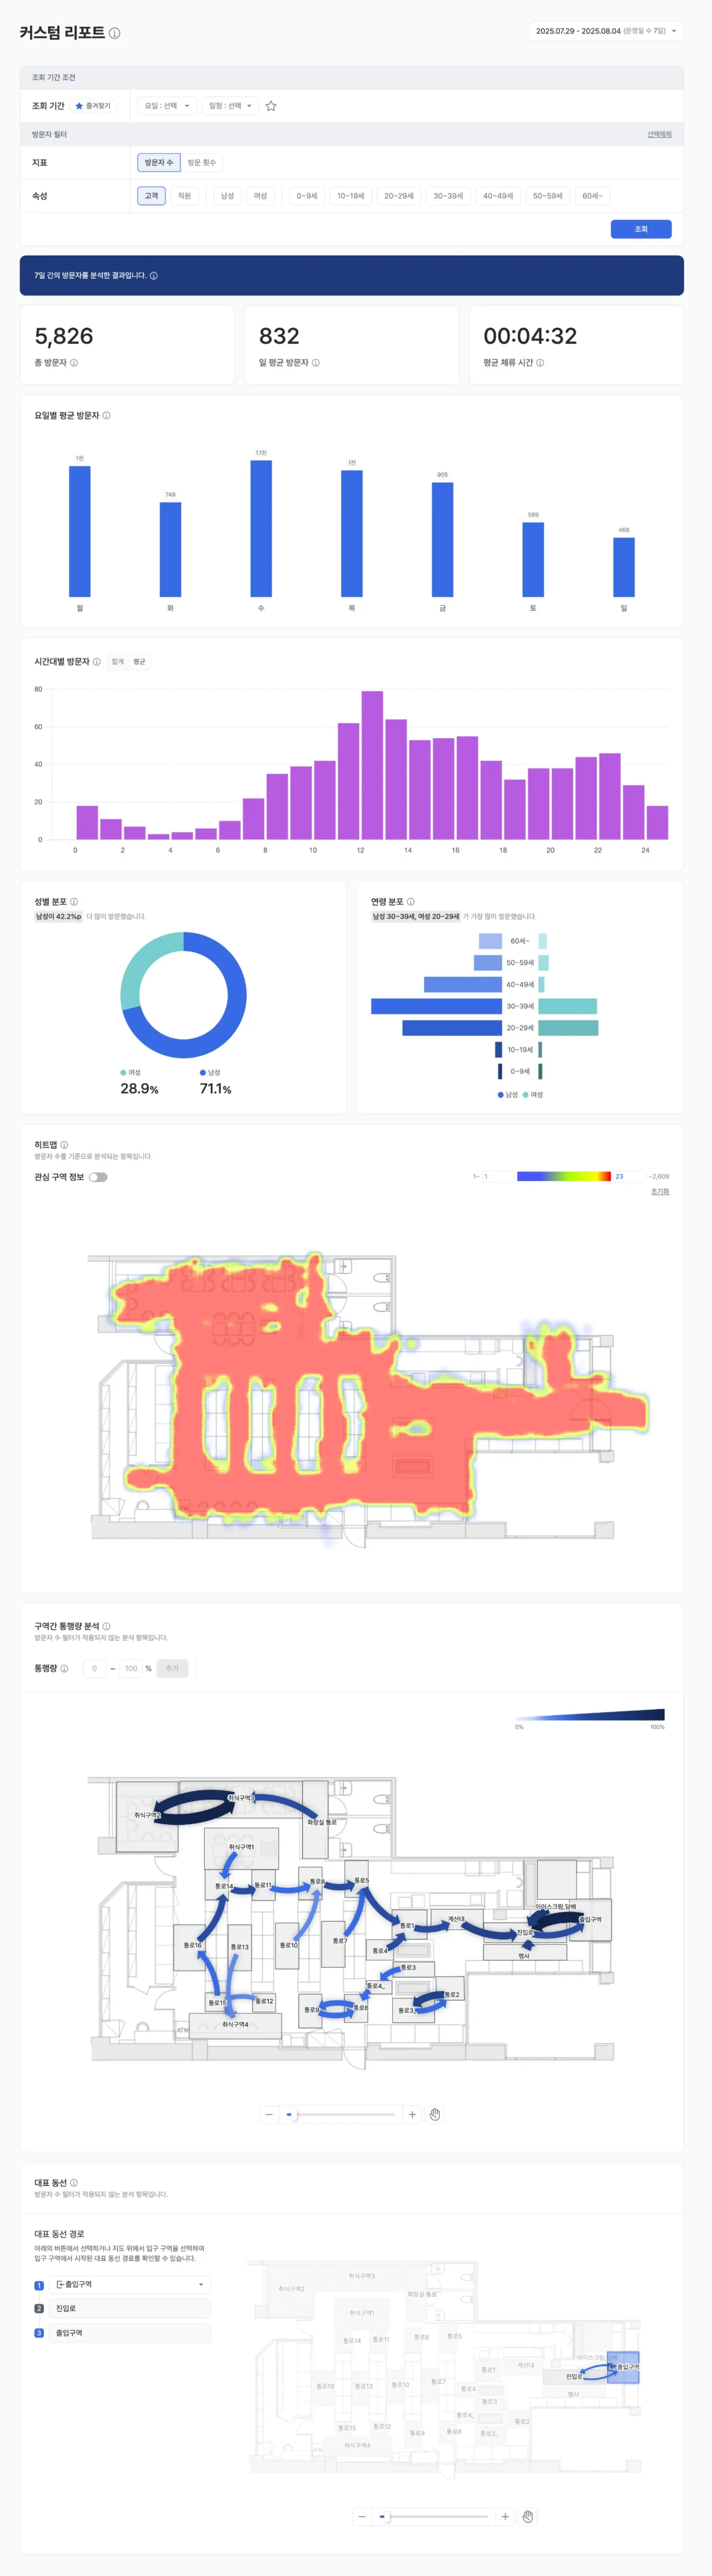
- Combine the analysis modules you want — visitor analysis, zone analysis, funnel analysis, and so on.
- See multiple metrics and visualizations integrated into a single view in one report.
- Examples
- Place heatmap + representative path + conversion rate in one report.
- For a specific zone, analyze dwell time, inflow, and segment behavior all at once.
Conditions and filters
- Date ranges (day / week / month / custom)
- Filters by zone, product category, or customer group (gender, age, etc.)
- Advanced filters such as time of day, repeat visit, and dwell time
- Examples
- “Show only behaviors from women in their 20s with at least 5 minutes of dwell time during June.”
- “Track representative paths during the event period that had a high checkout reach rate.”
Comparison and time-series features
- Before/after comparison: A/B tests, promotion impact, and post-layout-change performance
- Cross-store comparison: Compare performance across stores using the same report template (multi-store operations)
- Period-over-period trends: Track conversion rate, dwell time, and other key metrics over time
Use cases
Marketing campaign performance report
- Modules: visitor count, dwell time, purchase conversion
- Filters: campaign period + target customer group
- Comparison: before vs. after campaign
→ Produces insights such as “Inflow grew but conversion dropped — we need to improve the leaflet.”
Shelf renewal impact analysis
- Modules: zone-level inflow, dwell, pickup, purchase
- Filters: specific product zones
- Comparison: before vs. after the renewal
→ Yields diagnoses like “Dwell time rose, but pickup dropped — the display style needs review.”
Automated regular reporting
- Weekly report: Bundle the same KPIs into the same format every week.
- Executive summary: Auto-generate a single-page summary for executives.
- Conditional comparisons: Rainy days vs. clear days, event period vs. baseline, and similar splits.