Purchase Conversion Rate
Purchase Conversion Rate quantifies the most important final stage of the customer journey: the act of buying.
Instead of “how many customers visited,” it answers “how many actually opened their wallets.”
The ultimate goal of every store analysis (heatmap, paths, dwell, etc.) is to lift this number, and this metric lets you validate operational strategy, marketing impact, and the presence of bottlenecks.
Prerequisites
- A checkout zone must be defined under Zone settings.
- The dwell-time threshold for the checkout can be adjusted to fit your operational policy — contact Deeping Source to configure it.
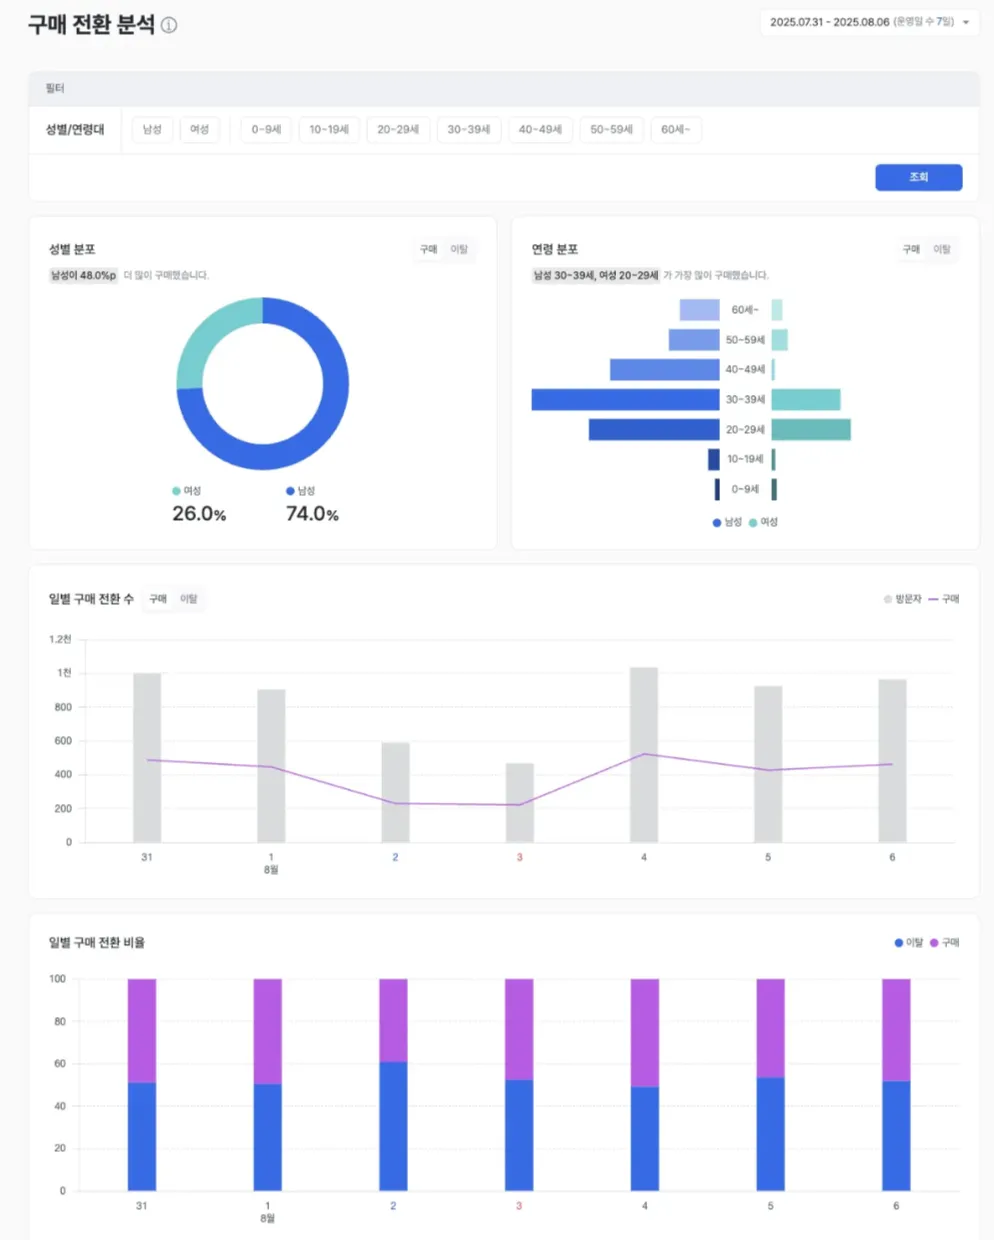
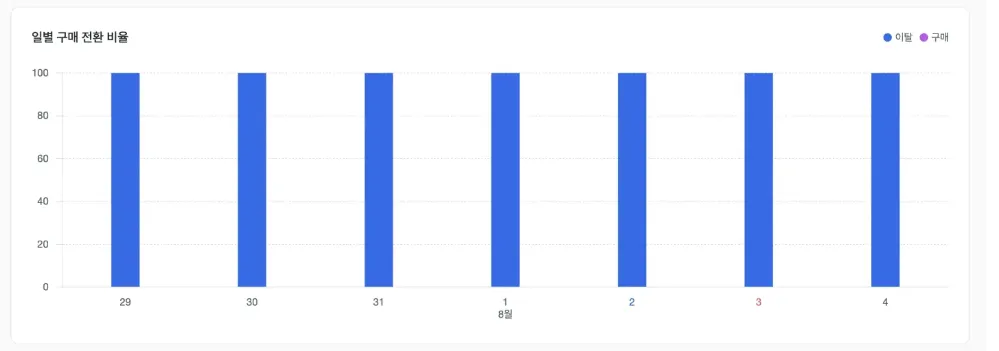
Report layout
Conversion definition and measurement
- Calculates the share of visitors who purchased out of total visitors. It’s typically estimated based on people who lingered in the checkout zone for at least a set time.
Examples
- Daily conversion tracking → KPI for store operating health
- Cross-store comparison → Benchmark top performers and surface improvement points for laggards
Campaign / event impact (ROI analysis)
- Use changes in conversion before and after a defined period to quantitatively measure marketing impact.
Examples
- Visitors increased but conversion dropped? → Likely an inflow of low-converting cherry-pickers → Re-evaluate targeting.
- Conversion rose? → Promotion is working → Consider scaling similar tactics.
Conversion by product / zone
- Analyzes the share of customers who visited a zone and purchased the corresponding product category. (Requires POS integration or pickup-based analysis.)
Examples
- Wine corner conversion 10% vs. beer corner 30% → Diagnose pricing, display, and information delivery, then improve.
Conversion by segment
- Apply filters such as gender, age group, or time of day to break conversion down.
Examples
- Overall conversion 15%, women in their 30s: 25%, men in their 20s: 5% → Define VIP customers and focus targeted marketing resources accordingly.

Funnel flow and bottleneck diagnosis
Conversion delivers the most powerful insight when you read it alongside the full customer journey.
| Stage | Analysis | Metric | Key question |
|---|---|---|---|
| Visit | Visitor analysis | Total visitors | Are we attracting customers well? |
| Explore | Zone / heatmap | Dwell time | Does the merchandising spark interest? |
| Consider | Pickup / traffic | Product touches | Are customers actually handling products? |
| Purchase | Conversion analysis | Purchase conversion | Do customers ultimately open their wallets? |
Examples
- High drop-off between explore → consider? → Possible price, information, or appeal issue → Combine heatmap + pickup + performance matrix to investigate.
Use cases
| Strategic area | Expected outcome |
|---|---|
| Revenue optimization | Concentrate resources on high-conversion products and zones; improve underperforming zones |
| Operational efficiency | Eliminate drop-off causes (e.g., long queues, payment friction) |
| Marketing ROI | Measure actual purchases vs. visits to quantitatively validate campaign performance |
Revenue optimization
Concentrate resources on high-converting “hero” products and zones, and improve the laggards to lift overall sales.
Operational improvement
Identify the causes of drop-off right before purchase (e.g., long checkout queues, complex payment flows) and minimize lost conversions.
Maximizing marketing ROI
Replace gut-feel evaluation with the clear data of “purchase conversion rate” to measure marketing campaign success and allocate budgets efficiently.
Linked analysis
- For zones flagged as Leaky Buckets (exposure↑, interest↓) or Hidden Gems (exposure↓, interest↑) in the Zone Interest matrix, layer in purchase conversion to decide which strategies to change first.
- Combine with heatmap + pickup → Diagnose conversion bottlenecks at the product level.
Trend-based judgment
- Evaluate weekly and monthly trends, not raw daily numbers.
- A steady upward conversion trend signals real underlying improvement.