Shelf Analysis
Prerequisites
- A shelf zone must be defined under Zone settings.
Report layout
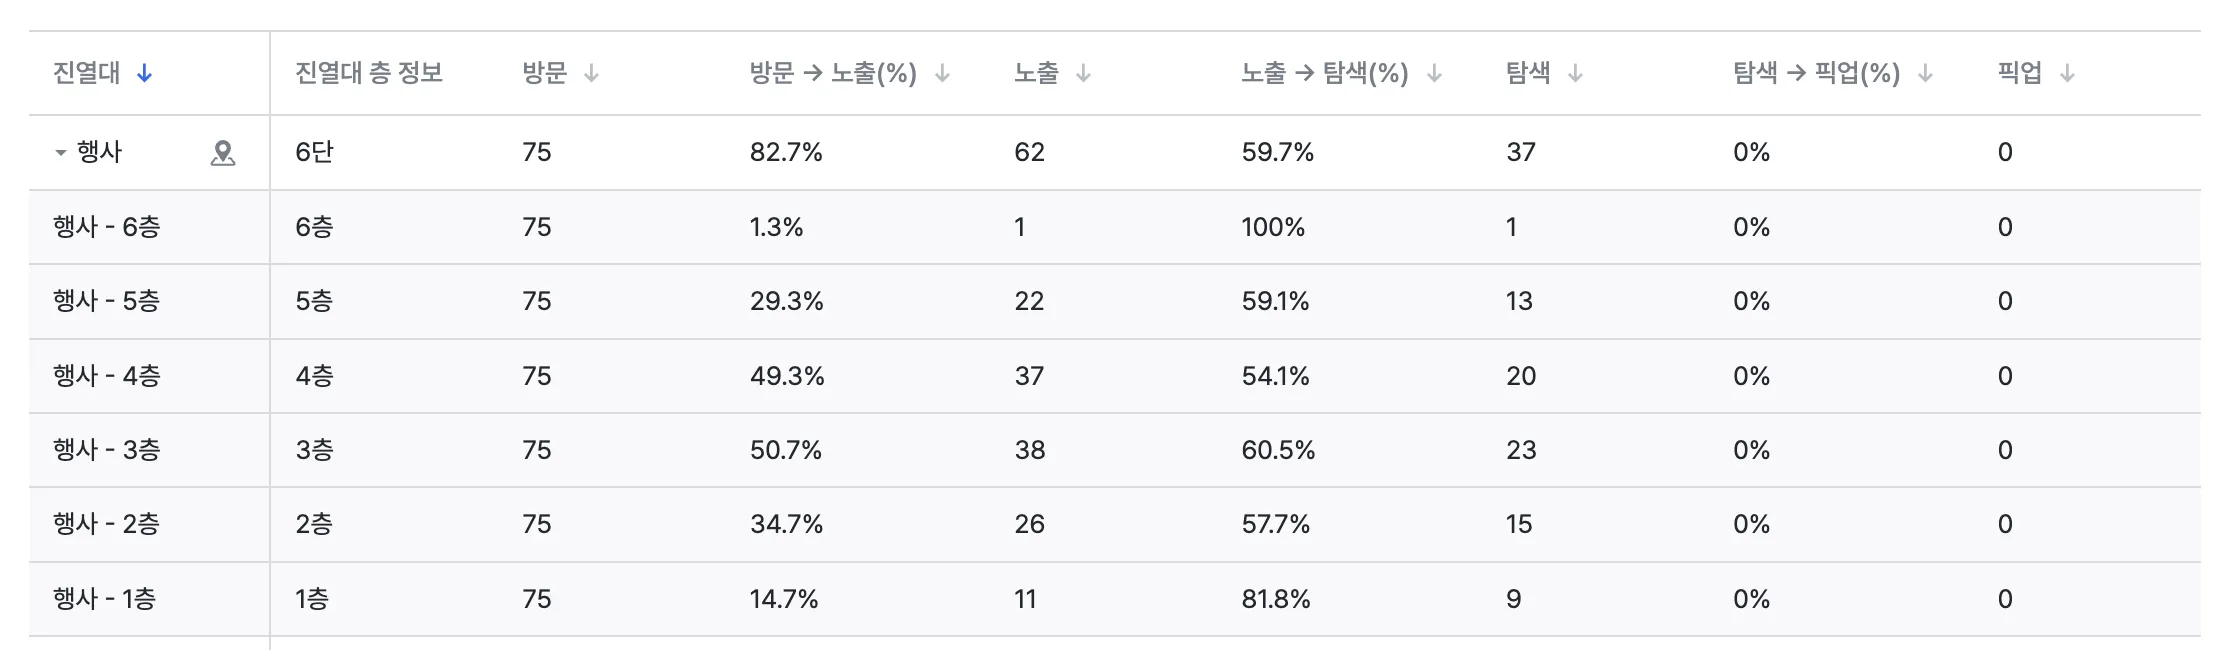
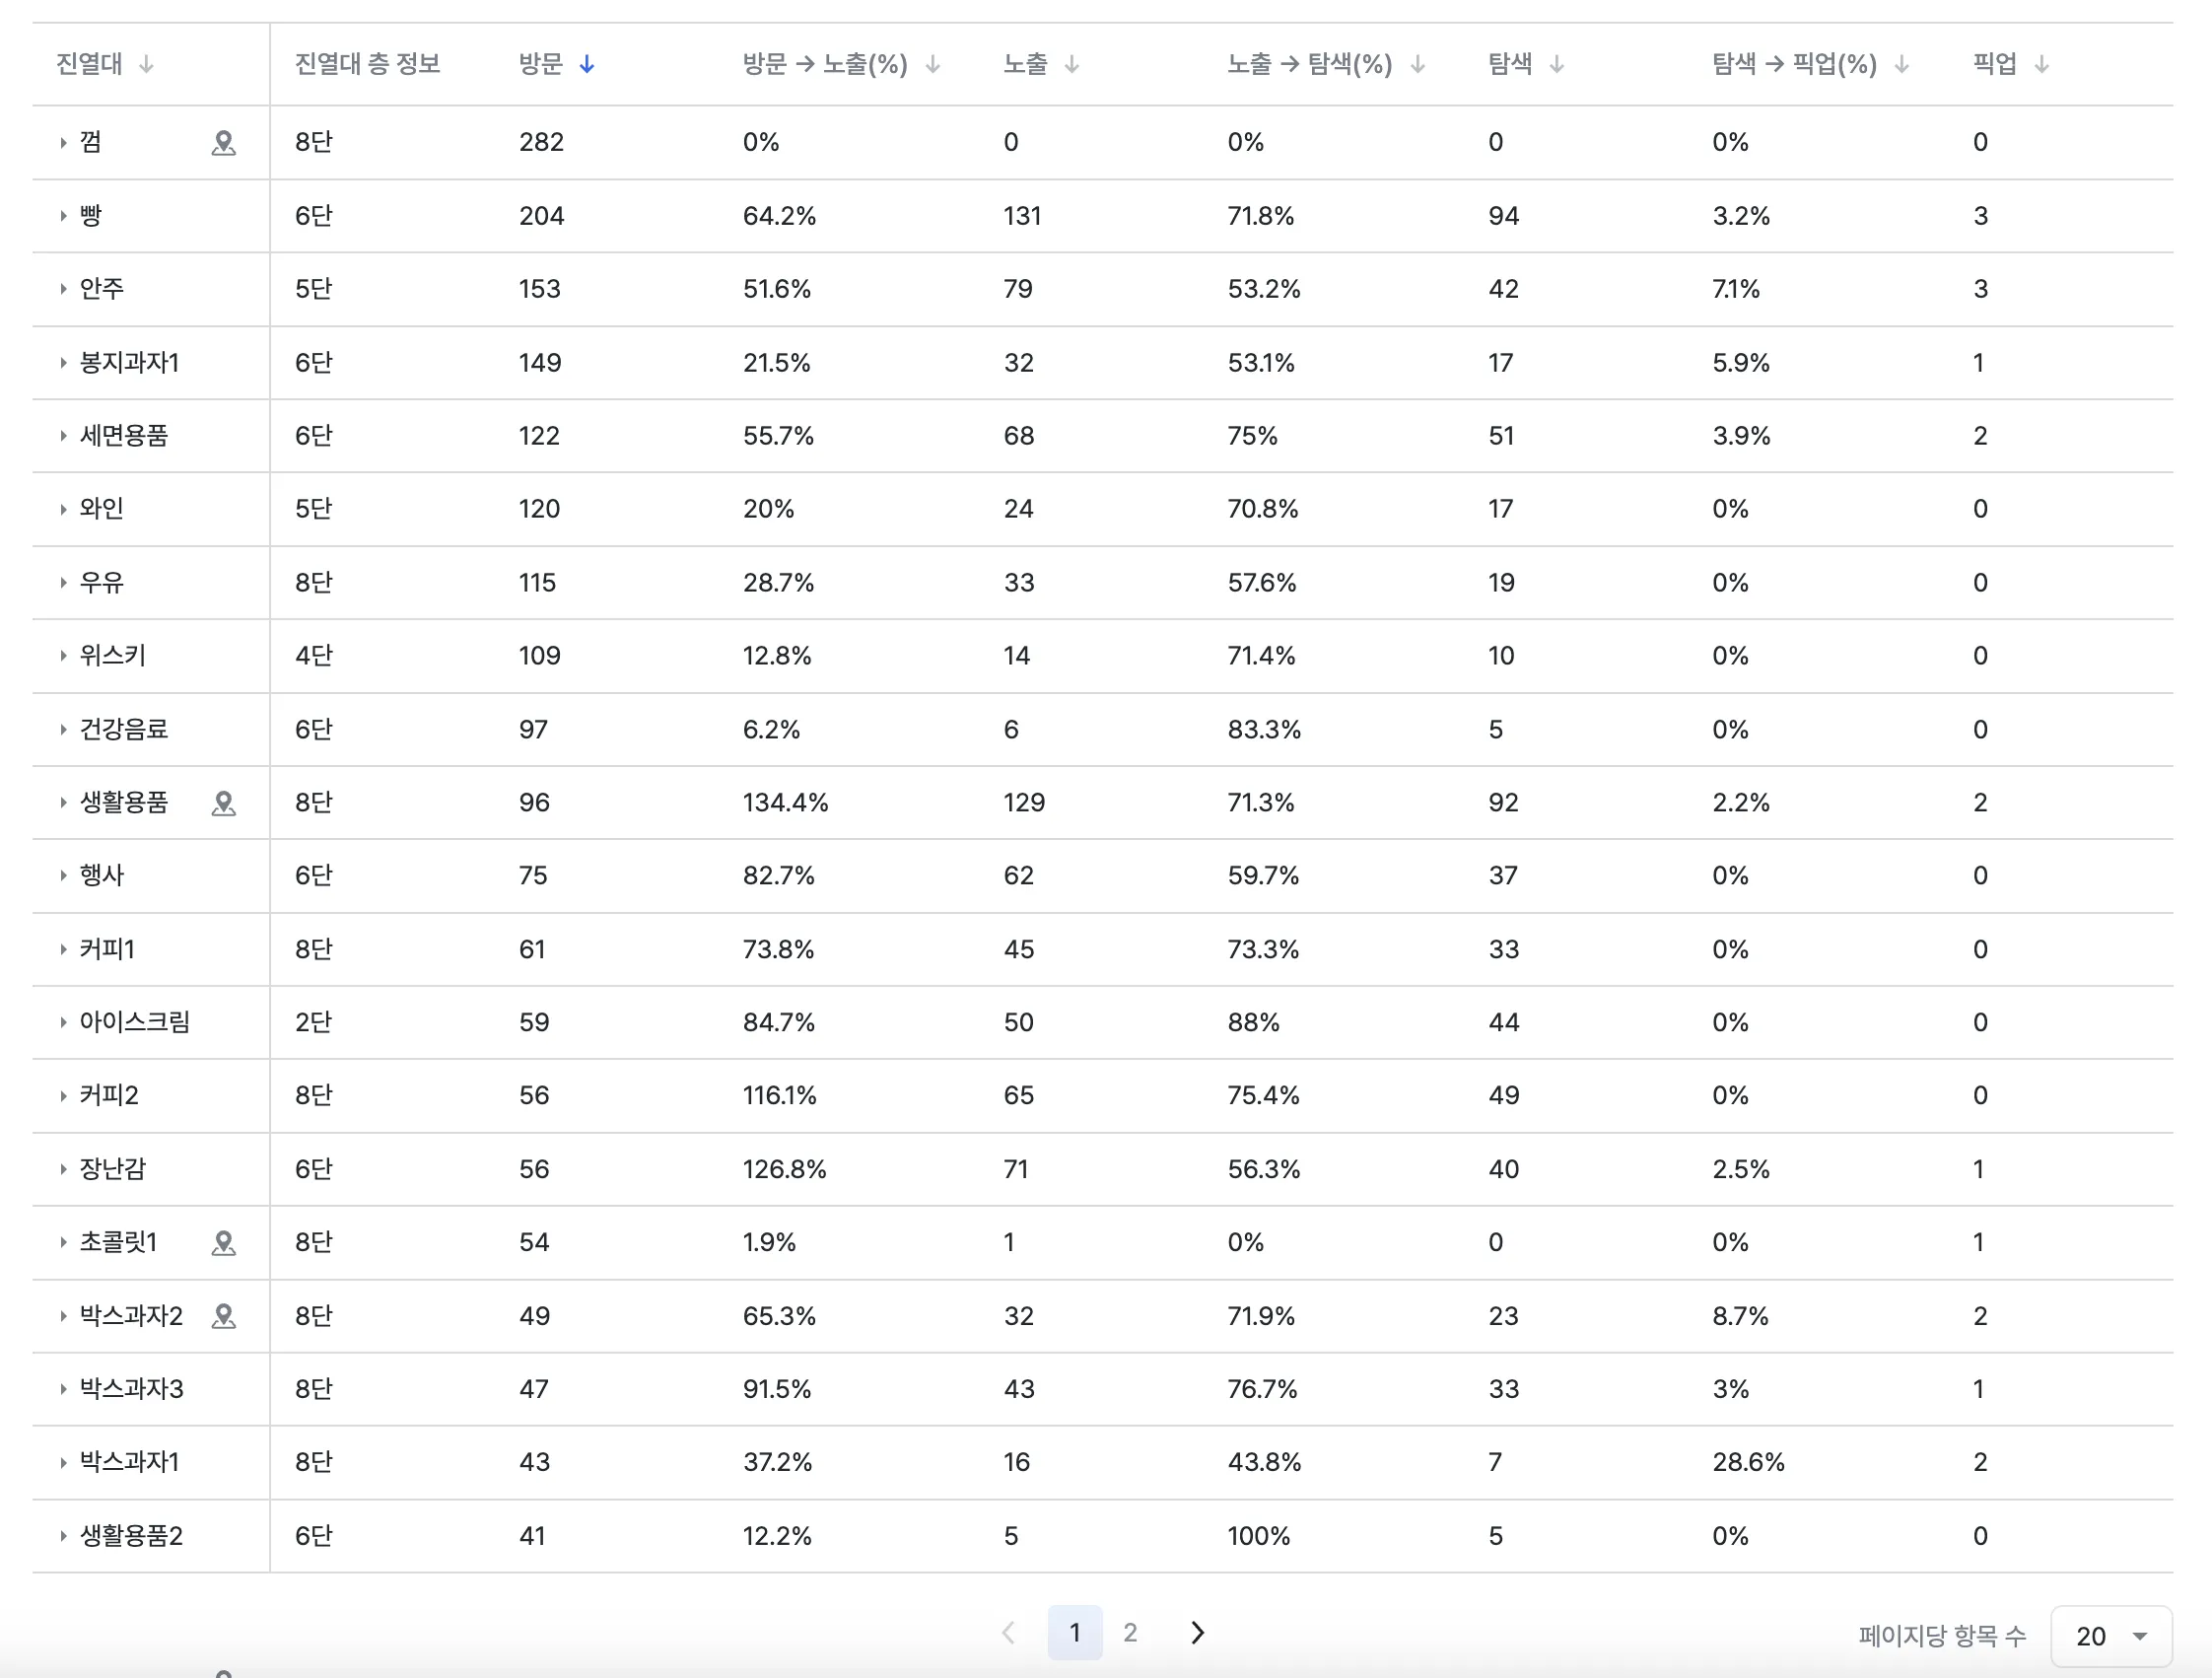
Shelf Analysis measures the performance of each shelf in your store with detailed data. It quantifies customer visit, exposure, exploration, and pickup behavior for entire shelves and individual levels (rows), and presents the data in tabular form — a core tool for prioritizing merchandising improvements.
Core features
Shelf funnel analysis
- Measures customer behavior across a four-stage funnel: visit → exposure → exploration → pickup.
- Shows conversion rate at each stage, precisely diagnosing where customer interest drops off (the bottleneck).
Examples
- Identify shelves and levels with many looks but few pickups, and surface possible issues with product appeal, pricing, or display style.
- Find shelves with low exposure → exploration conversion, improve the way product info (POP) is delivered, then validate the impact.
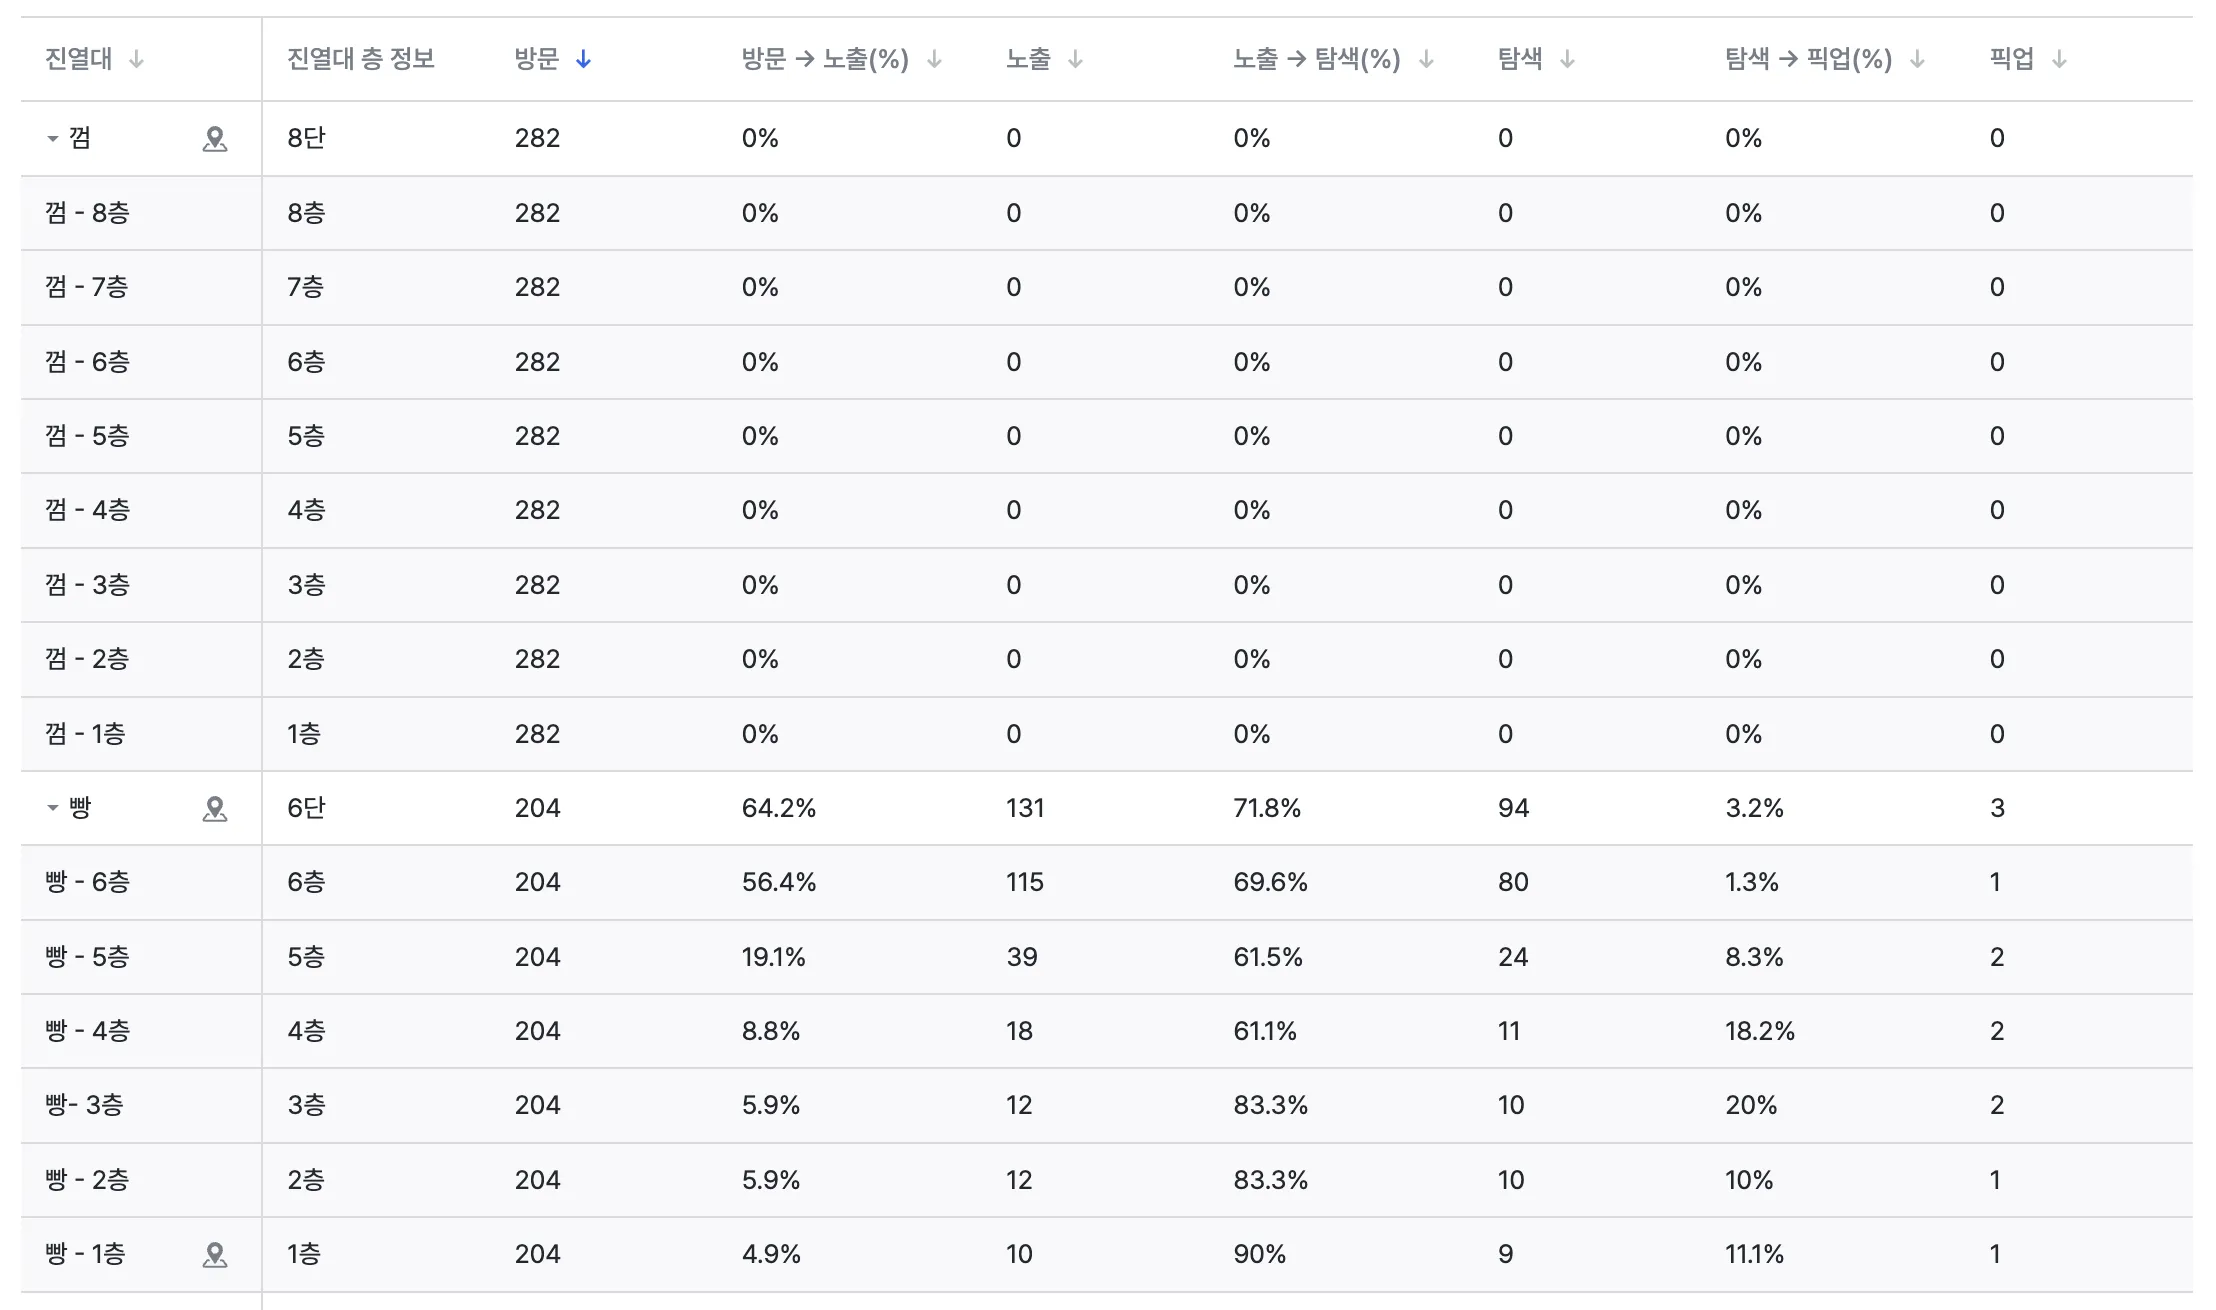
Shelf and level detail view
- See performance data not just for an entire shelf, but also for individual levels (rows).
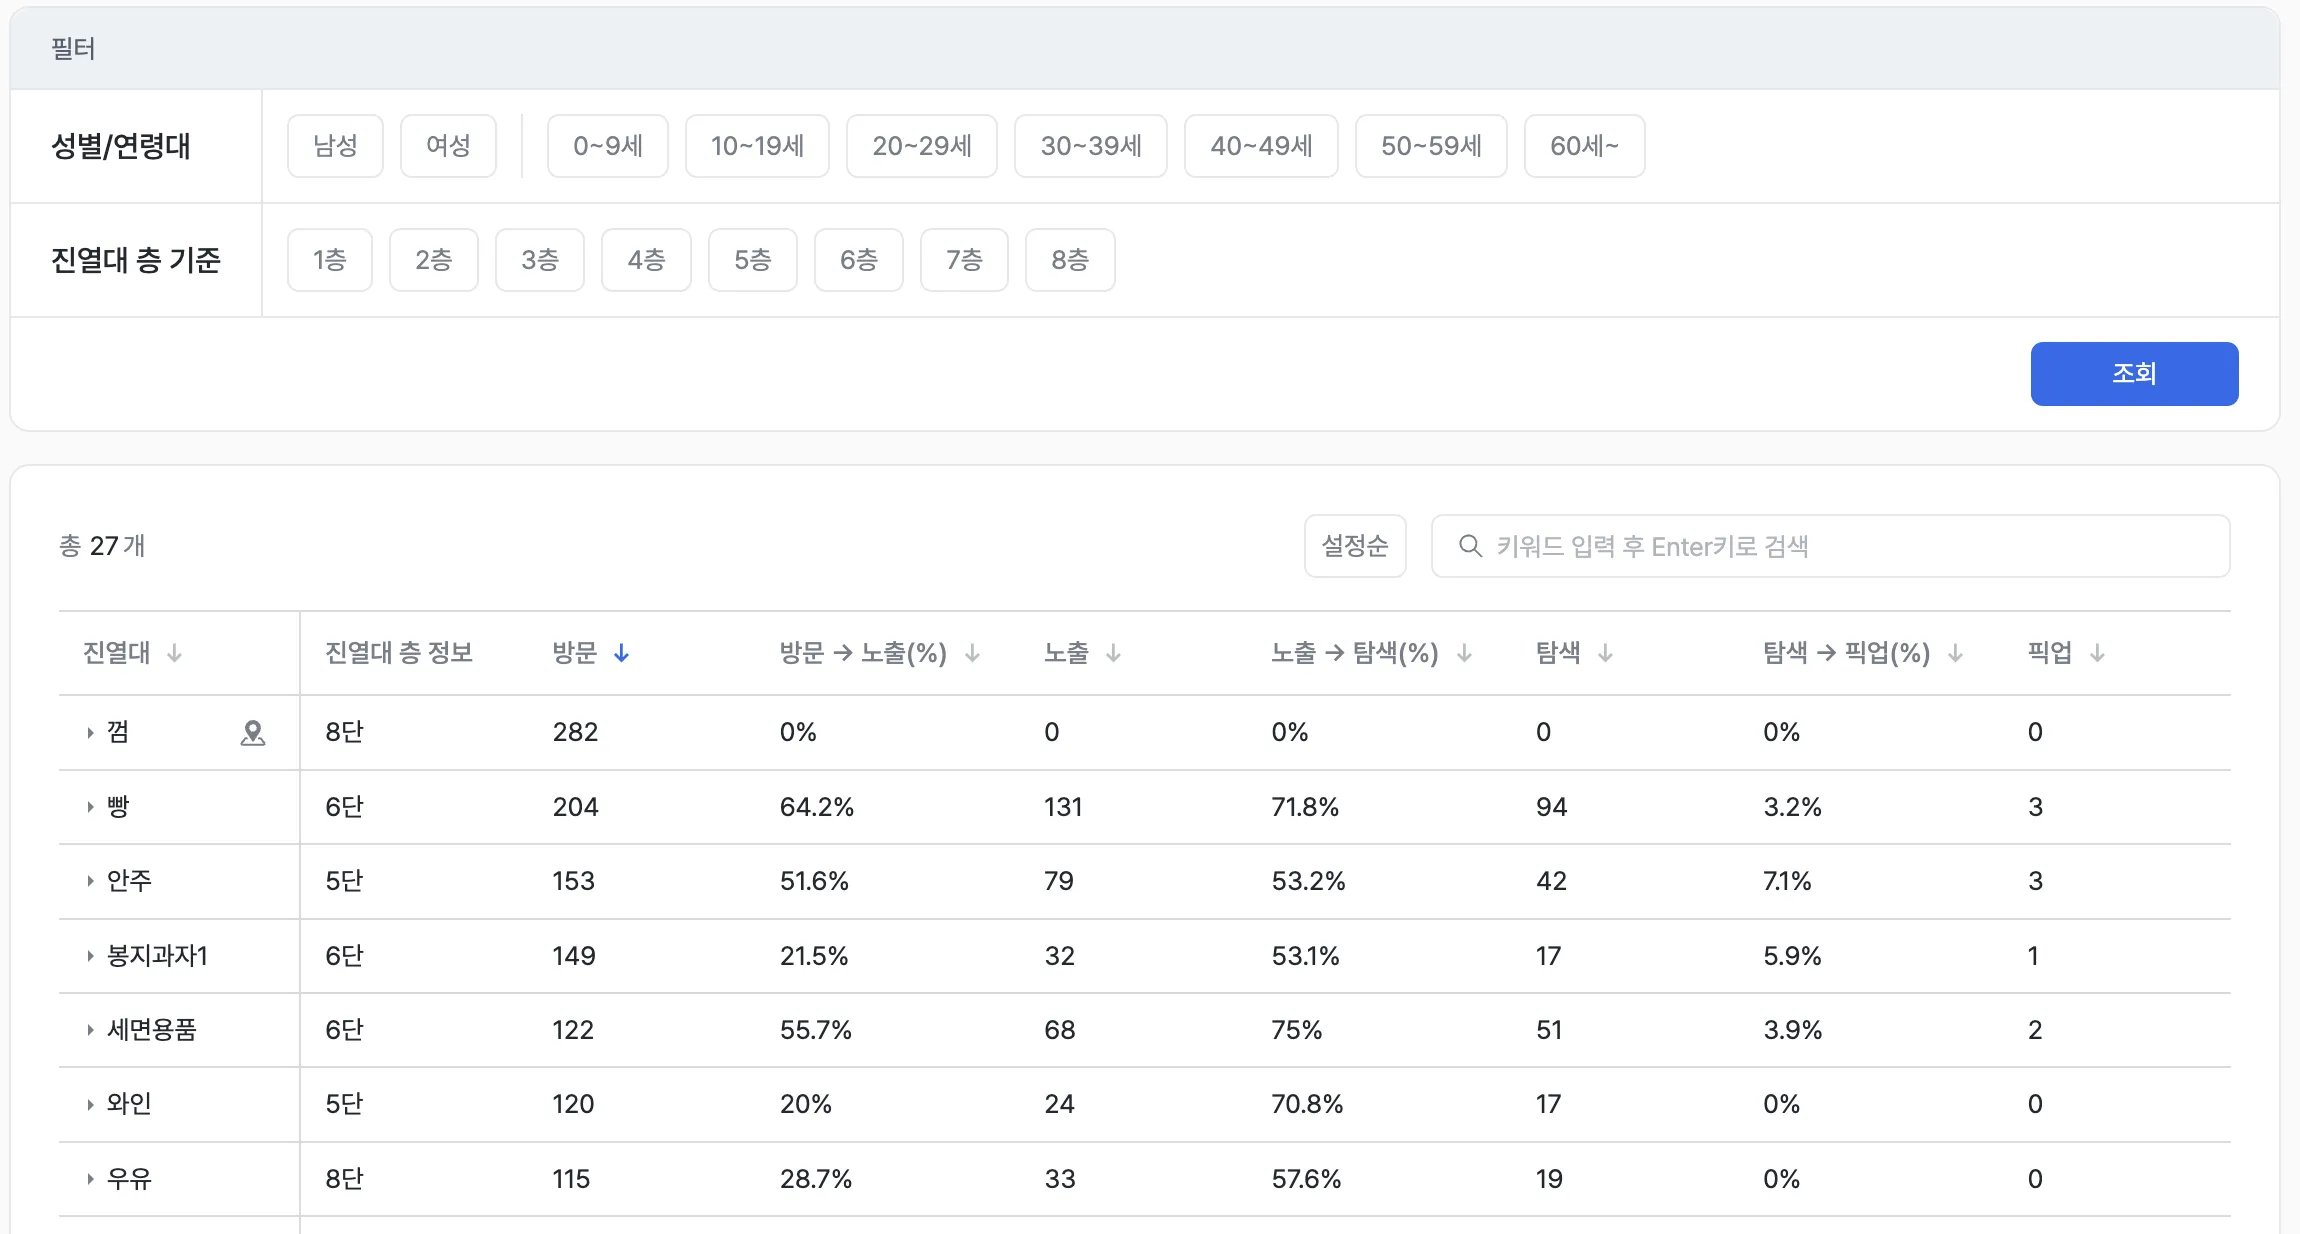
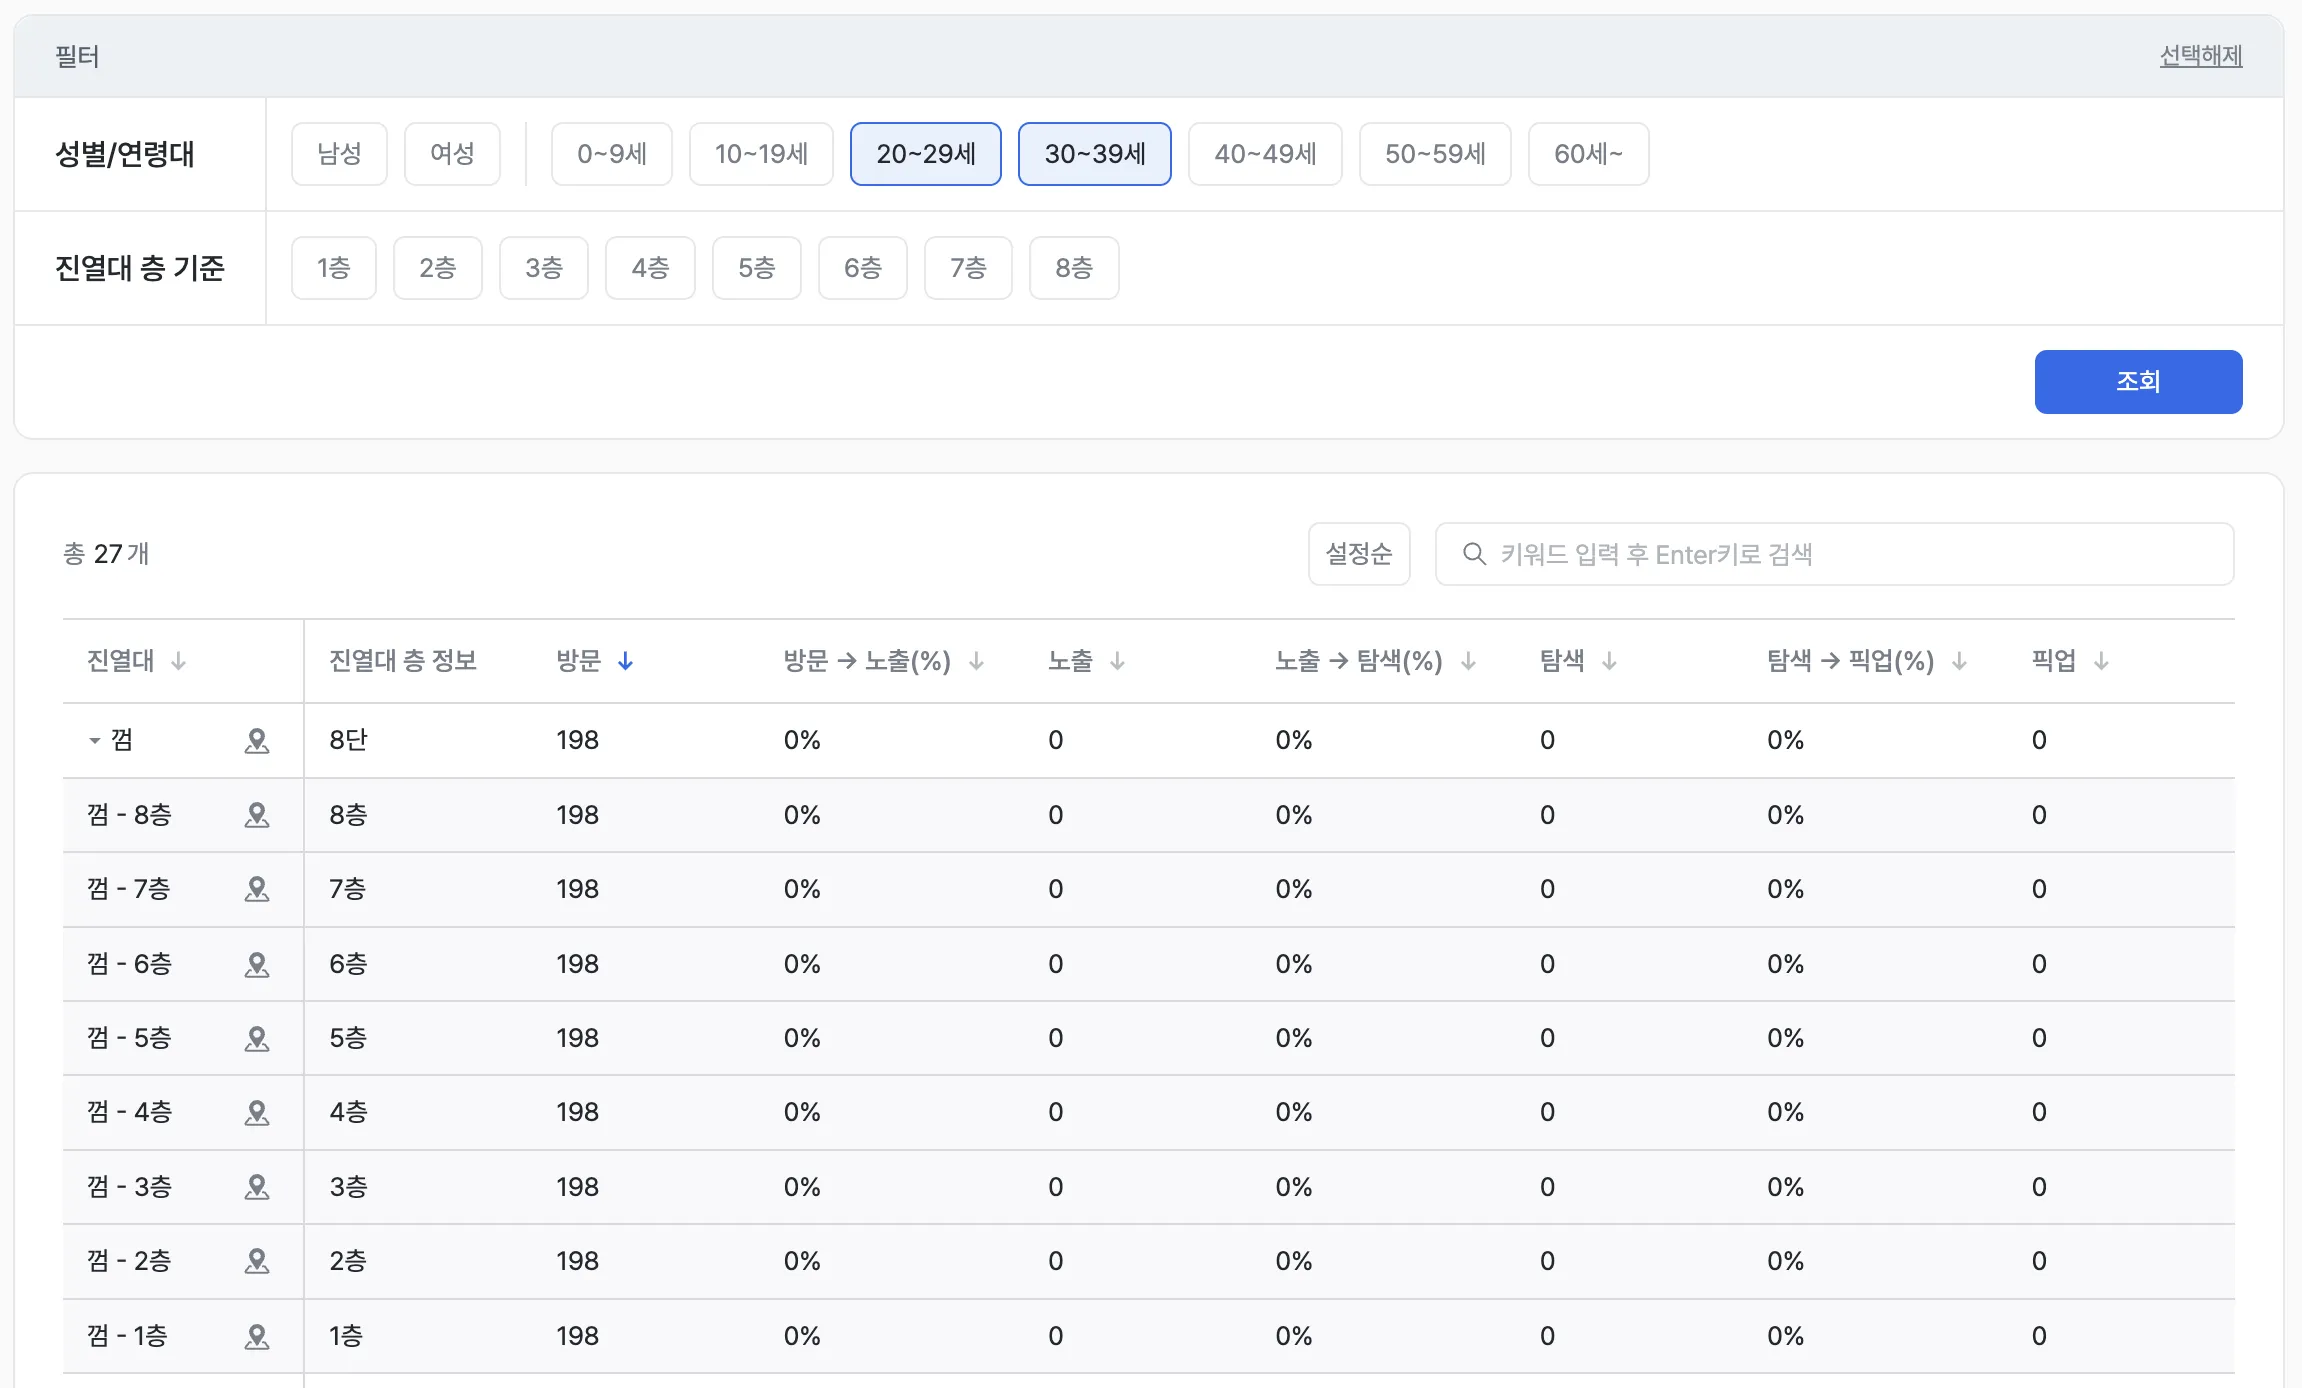
- Apply gender and age filters to analyze how target audiences respond to specific shelves and levels separately.
Examples
- Compare pickup rates across top, middle, and bottom levels to define your “Golden Zone” and optimize product placement.
- Spot patterns where a particular group only picks from the “middle” level of a shelf, and design targeted merchandising strategies.
Key metrics (KPIs)
| Metric | Description | Insight |
|---|---|---|
| Visit → exposure rate | Share of passing customers who actually looked | Diagnose shelf visibility and attention |
| Exposure → exploration rate | Share of viewers who looked with intent for at least the threshold time | Evaluate product appeal and information delivery |
| Exploration → pickup rate | Share of explorers who actually picked up | Measure how well interest turns into action |
| Per-level performance | Exposure and pickup rates at the row (level) of a shelf | Basis for analyzing height-based differences and improving placement |
Use cases
Optimize product placement and merchandising
- Diagnose shelves with high exposure but low pickup, and surface improvement levers across pricing competitiveness, VMD, and lighting.
- Use level-level performance data to find the most efficient height for a product and refine placement strategy.
Quantitative validation of promotions
- Compare metric changes for a shelf before and after a promotion to objectively measure ad and event impact.
- Identify low-performing shelves to prioritize improvements and avoid wasting resources.
Reinforce operations and inventory strategy
- Concentrate stock and staff on shelves and levels that drive revenue or hold high potential, maximizing operational efficiency.
- Separately analyze the “exposure” stage (where attention concentrates) and the “pickup” stage (actual behavior) to judge merchandising impact.
Advanced tips
Summary
Shelf Analysis is the core analysis tool that measures the performance of each shelf and its levels (rows) across a multi-stage funnel of visit, exposure, exploration, and pickup. Data-driven conversion rates surface concrete actions for refining product placement, promotions, and operations down to the level (row).