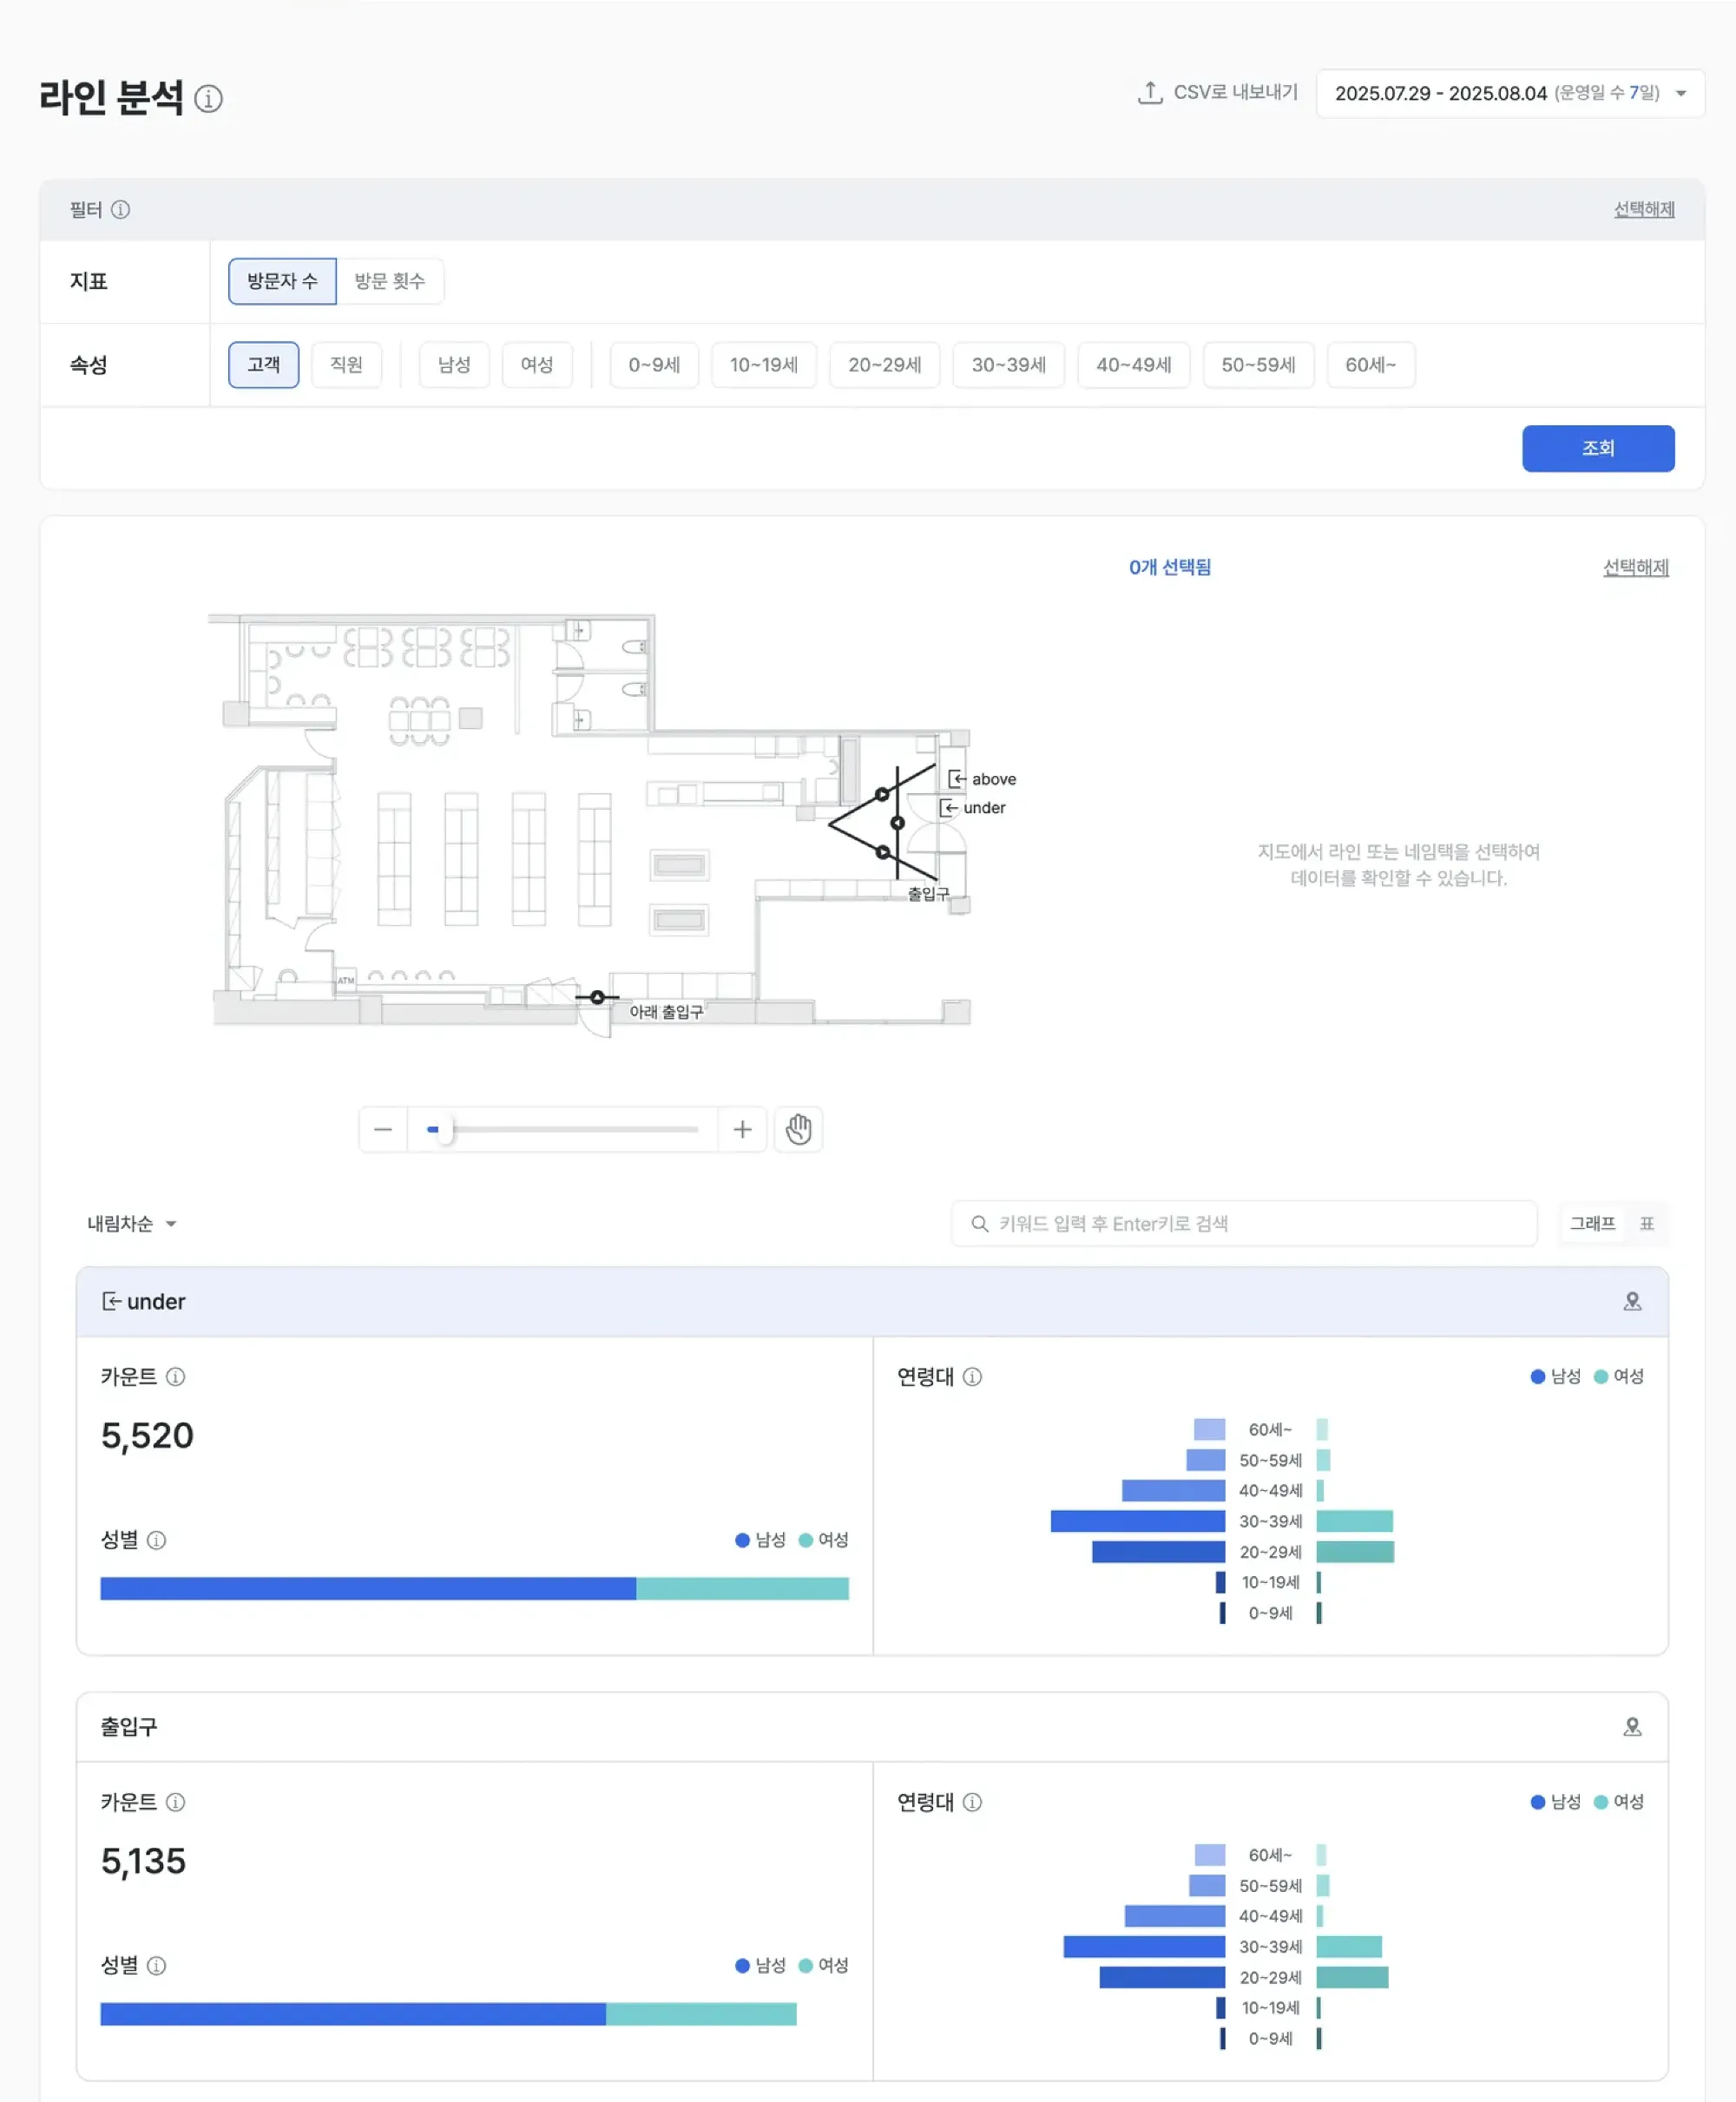
Line analysis
Line analysis lets you draw “virtual lines” at specific locations in your store and automatically counts and analyzes the customers who cross them, along with their demographics. Beyond simple people counting, it estimates gender and age, excludes staff, and compares inflow across locations — so you can understand customer behavior precisely and optimize store operations.
For instructions on creating lines, see the Line settings guide.
Report layout
Line setup and A/B testing
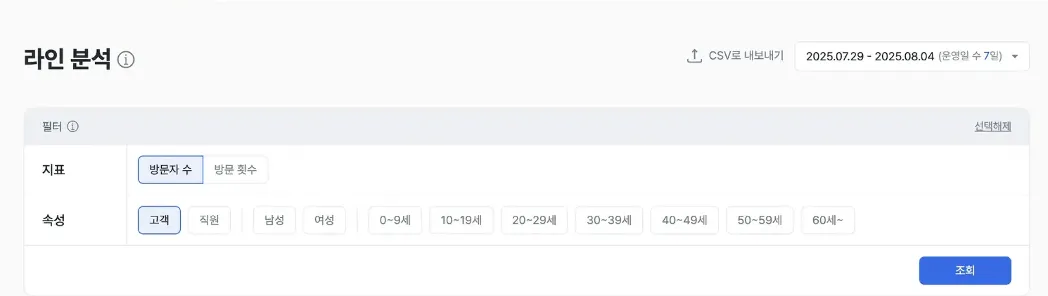
- You can create, edit, and delete lines on the store floor plan in settings.
- You can choose to view data by either visitor count or visit count.
Examples
- Compare line crossings to validate the actual inflow effect of merchandising strategies.
- Place lines at strategic locations to measure how concentrated customer paths are.
- Use entrance and exit lines to diagnose visitor counts.
Visitor counting and demographics
- The system automatically estimates and records the count, gender, and age group of customers who cross a line.
- You can filter results by a specific gender or age group.
Examples
- Filter by a specific customer segment to verify marketing targeting accuracy.
- Analyze the demographics of customers crossing a line to design merchandise mix and placement.
- Compare line inflow before and after a display change.
Automatic staff exclusion filter
- The filter automatically excludes staff from the population that crossed each line, leaving you with pure customer data.
Examples
- Avoid data errors caused by staff movement being added to total traffic.
- Boost decision confidence with pure customer-data baselines.
- Capture genuine customer behavior data for accurate measurement of pulling power.
Key metrics (KPIs)
| Metric | Description | Use |
|---|---|---|
| Total crossings | Total people who crossed the line | Gauge the traffic volume at a specific location |
| Net visitors | The actual customer count with staff excluded | Accurate measurement of pulling power |
| Gender / age distribution | Share of crossings by gender and age group | Verify target fit for each location |
| Line crossing rate | Crossing rate of a given line relative to the entrance line | Diagnose path flow and identify drop-off points |
Expected outcomes
Accurate inflow measurement and performance validation
- Use virtual lines for objective, precise inflow measurement.
- Quantitatively compare traffic shifts before and after events or promotions.
Layout and path optimization
- Compare high-inflow and low-inflow lines to diagnose space efficiency.
- Analyze drop-off points to improve paths and merchandise placement.
More precise marketing targeting
- Identify the customer segments (gender / age) crossing a specific line and execute target marketing.
- Locate the in-store touchpoints that resonate with your target customers.
Operational efficiency and better shopping experience
- Compare crossings across lines to allocate staff and resources more efficiently.
- Analyze low-traffic lines to revive underused parts of the store.
Use cases
- Compare inflow efficiency by location — Identify which of multiple entrances or aisles draws the most inflow.
- Trace target customers — Analyze the gender and age distribution of customers who cross a specific line.
- Capture pure customer data — Use the staff exclusion filter to remove operational personnel from the analysis.
Advanced tips
Target inflow profiling
- Filter by gender and age to identify the lines specific customer groups cross, then design tailored strategies.
- Combine crossings with customer profiles to derive the most effective placement strategy for your target customers.
Display and event efficiency validation
- Set up lines and compare crossings and customer profiles to objectively determine the more effective display approach.
- Inspect the displays or POPs near low-inflow lines and measure how crossings change after improvements.
Path discovery and operations optimization
- Compare crossing rates across multiple lines to gauge how concentrated customer paths are and use it as a baseline for crowd management.
- Identify successful inflow patterns to refine staffing and inventory replenishment timing.