Zone Interest Analysis
Zone Interest Analysis is a tool that precisely diagnoses spatial performance by evaluating each zone in your store along two axes: visits (exposure) and interest (dwell ratio).
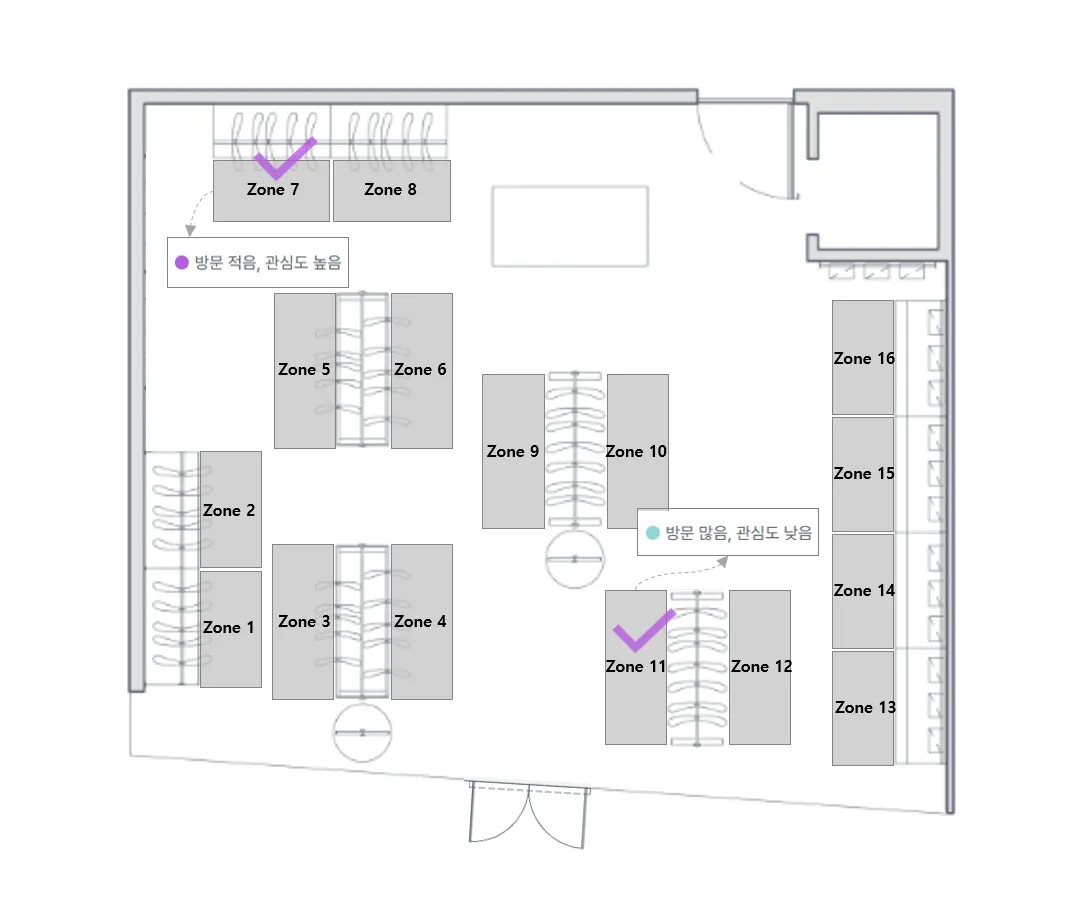
By combining the two metrics, zones are classified into four types and visualized with colors on the store map, so you can grasp each zone’s characteristics at a glance and craft strategies tailored to each type.
Much like the BCG matrix used to analyze a business portfolio, this view classifies each zone into four types, clearly defines its character, and helps you build customized improvement strategies.
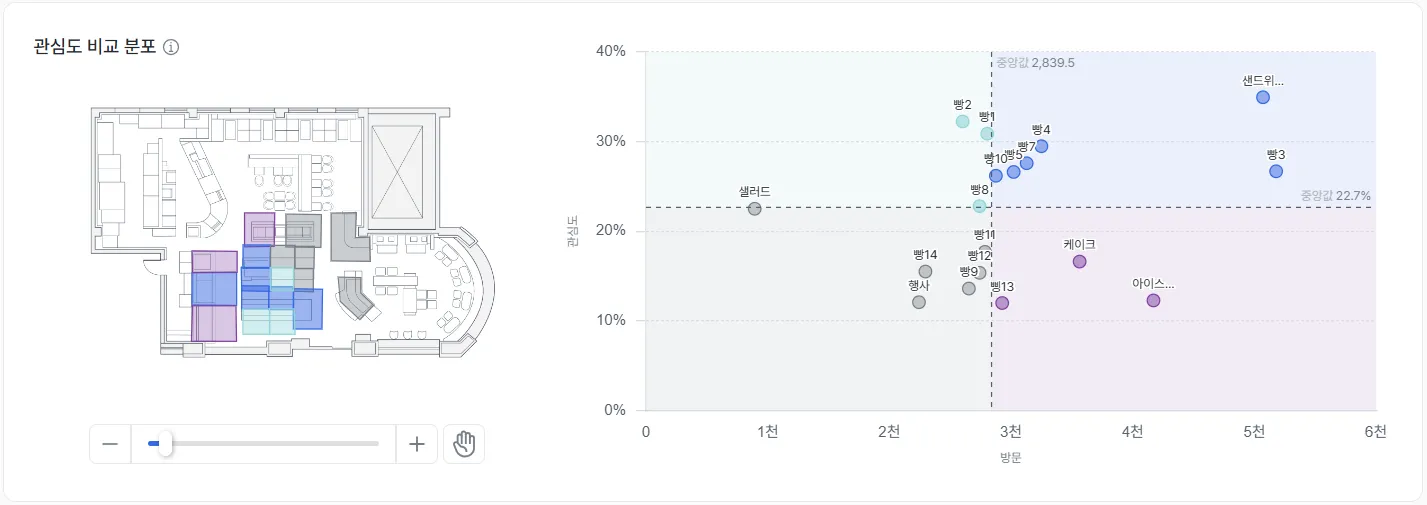
Report layout
Key metric definitions
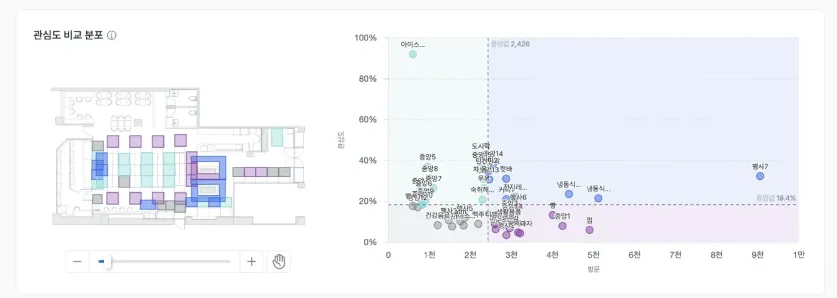
| Metric | Definition | Meaning |
|---|---|---|
| Exposure | Total number of people who visited the zone | The “pulling power” — location, accessibility, sightlines (X-axis) |
| Interest | Share of visitors who explored the zone (dwells ÷ visits × 100) | The “holding power” of products, displays, and content (Y-axis) |
| Dwell | Number of times someone stayed in one spot inside the zone for 5 seconds or more | Basis for calculating interest |
Four-quadrant analysis — diagnosing zones by type
Each zone falls into one of four types based on its exposure and interest.
| High interest | Low interest | |
|---|---|---|
| High exposure | Star Zone | Leaky Bucket |
| Low exposure | Hidden Gem | Question Mark |
Star Zones — High exposure & High interest
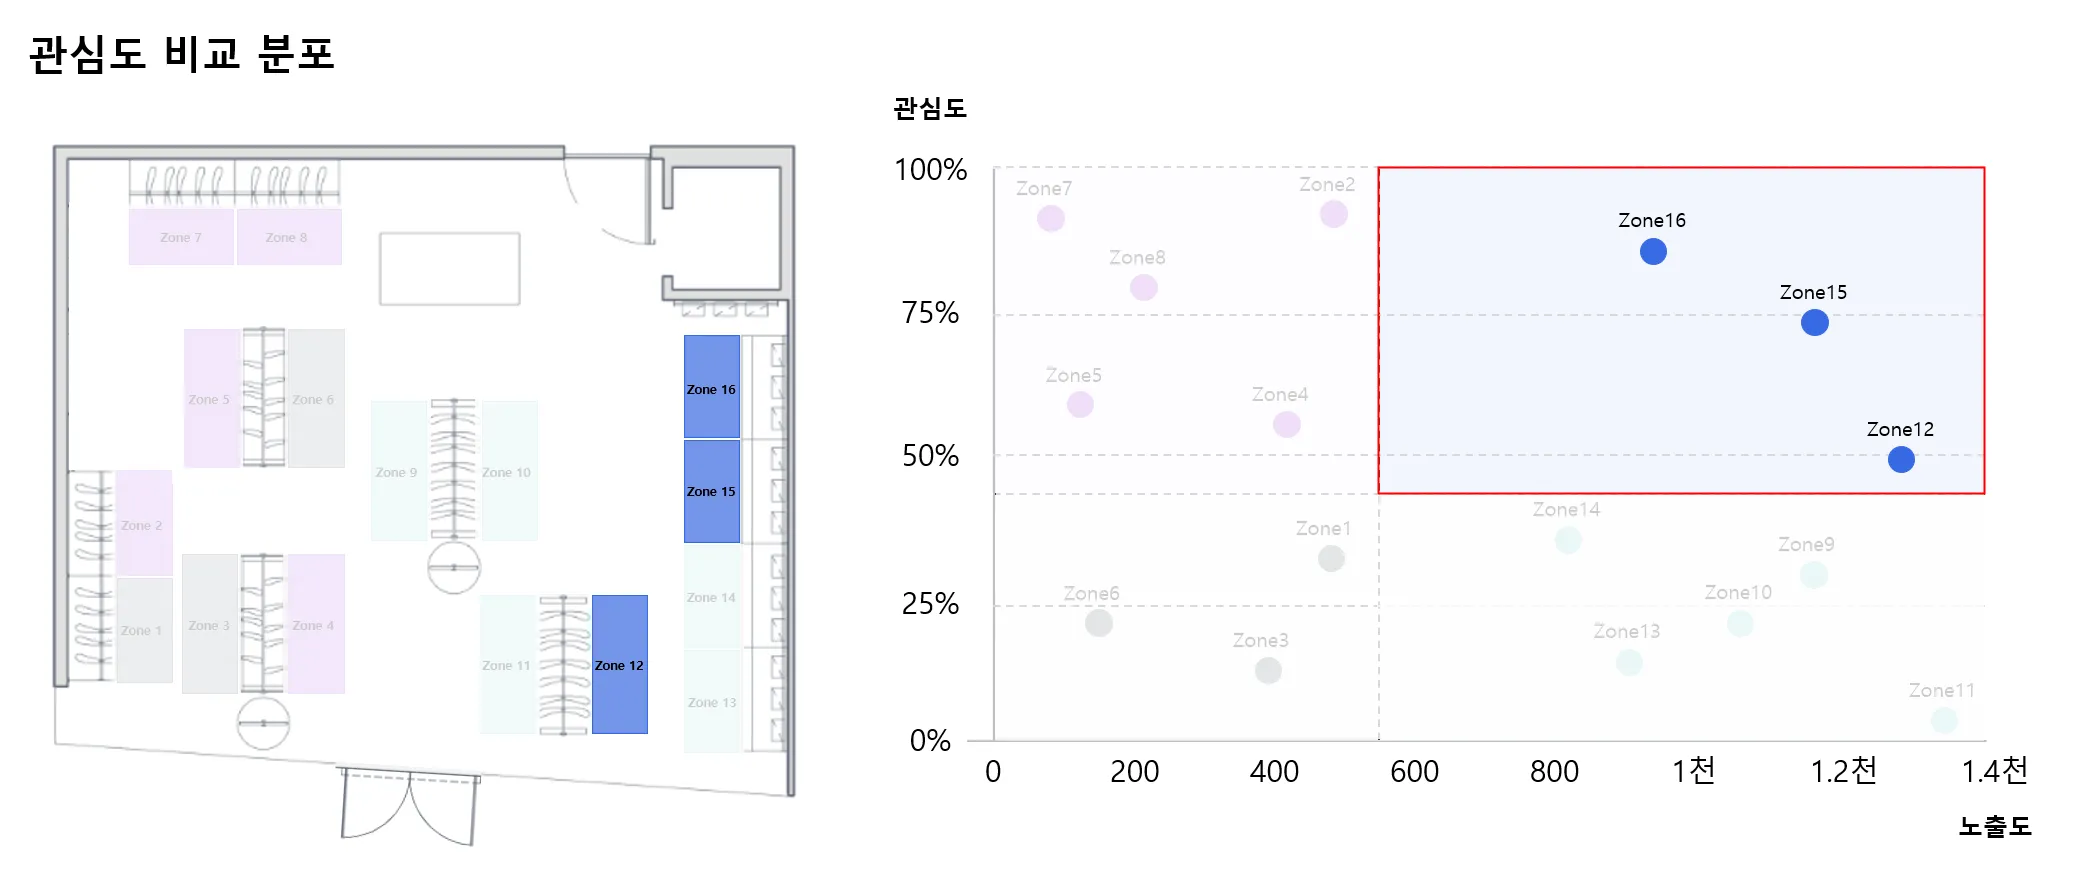
- Characteristics — High visitor counts and high dwell rates among visitors. The undisputed “core engine” of the store.
- Diagnosis — Either the layout puts this zone in the most advantageous position, or it features a strong product mix (flagships, new releases) that captures attention. Products here get the deepest exposure to the largest audience.
- Strategic actions
- Maximize revenue — Place the highest-margin products, new launches, and limited editions here to extract peak efficiency.
- Strengthen experience — Use sampling, demos, and experiential events to convert high interest into immediate purchases and positive brand experiences.
- Drive cross-sell — Place complementary categories adjacent to the Star Zone to nudge add-on purchases naturally.
Hidden Gem Zones — Low exposure & High interest
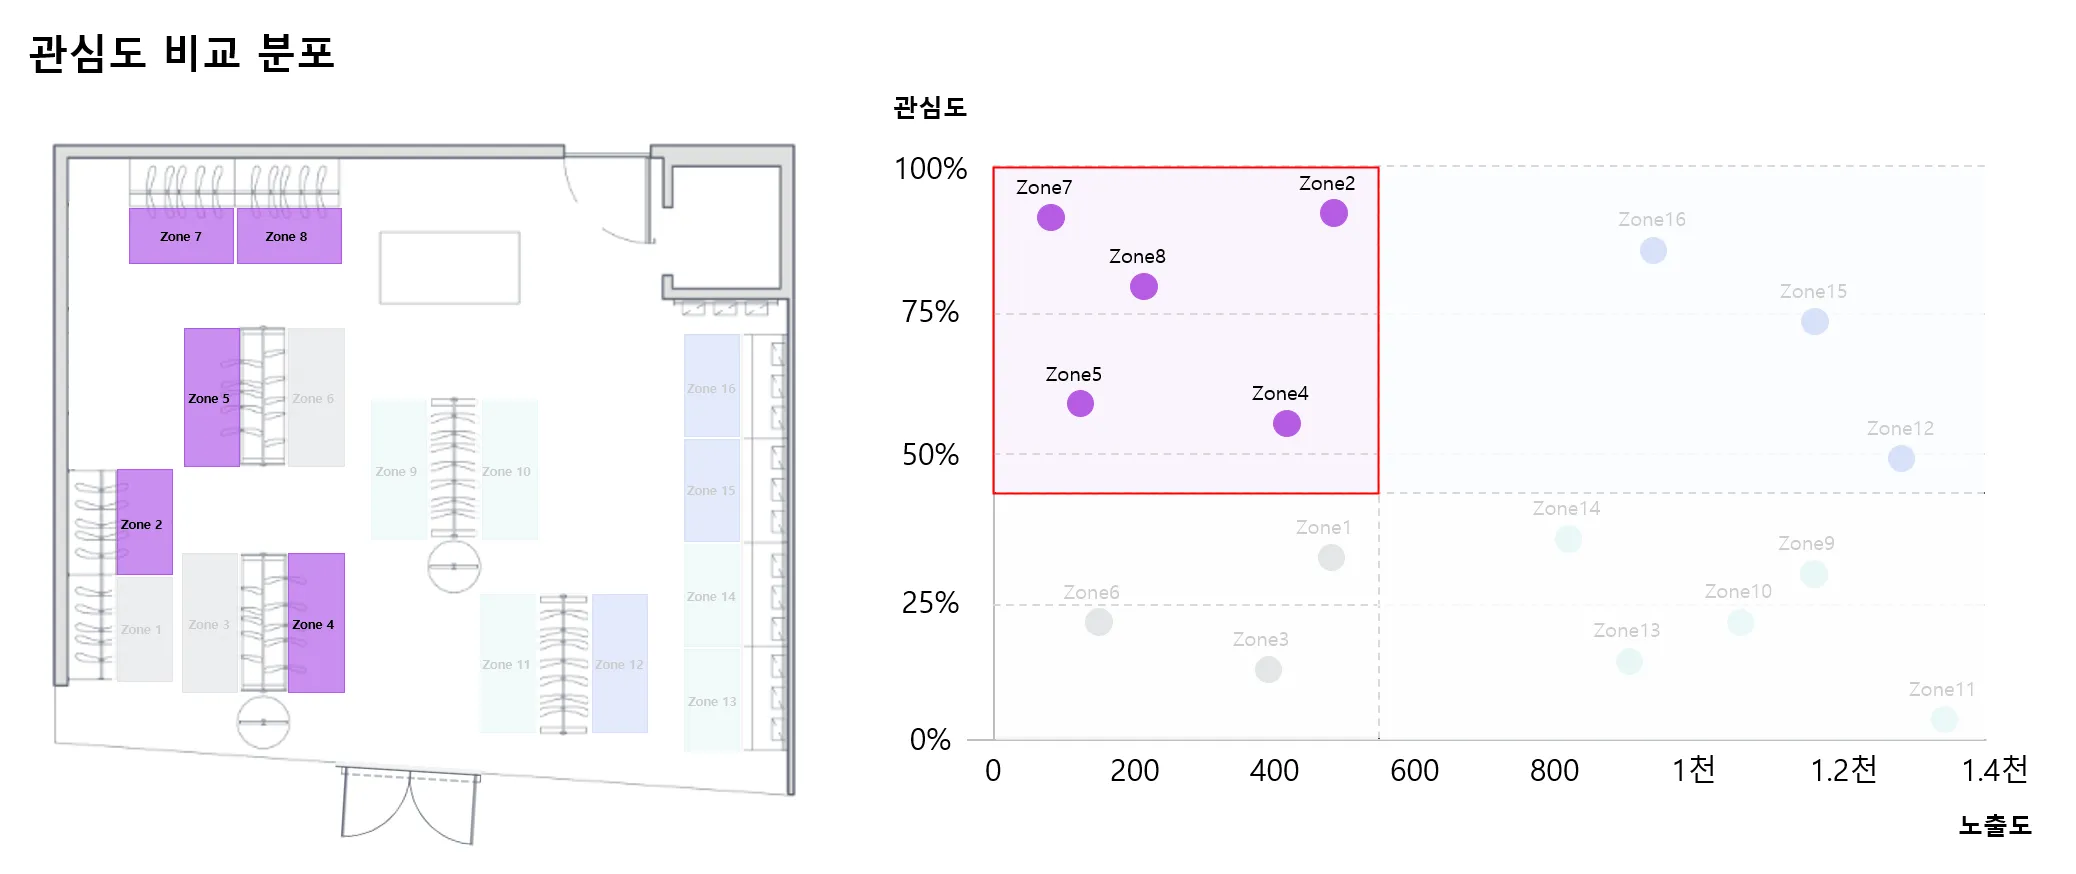
- Characteristics — A “destination shopping” zone visited only by those in the know. Few visitors, but the ones who arrive show very high loyalty and interest.
- Diagnosis — Either it carries niche category products for enthusiasts, or its products are so compelling that customers seek it out despite an unfavorable path. Strong revenue contributors are likely hiding here.
- Strategic actions
- Improve accessibility — Install wayfinding, floor signage, and similar cues from Star Zones or main paths to actively guide customers in.
- Strategic relocation — If the products show broad mass-market potential, consider boldly relocating them to a Star Zone to maximize exposure.
- Reinforce loyal customers — Strengthen the rare product lineup and provide expert information to maintain satisfaction and repeat-visit rates among the loyal core.
Leaky Bucket Zones — High exposure & Low interest
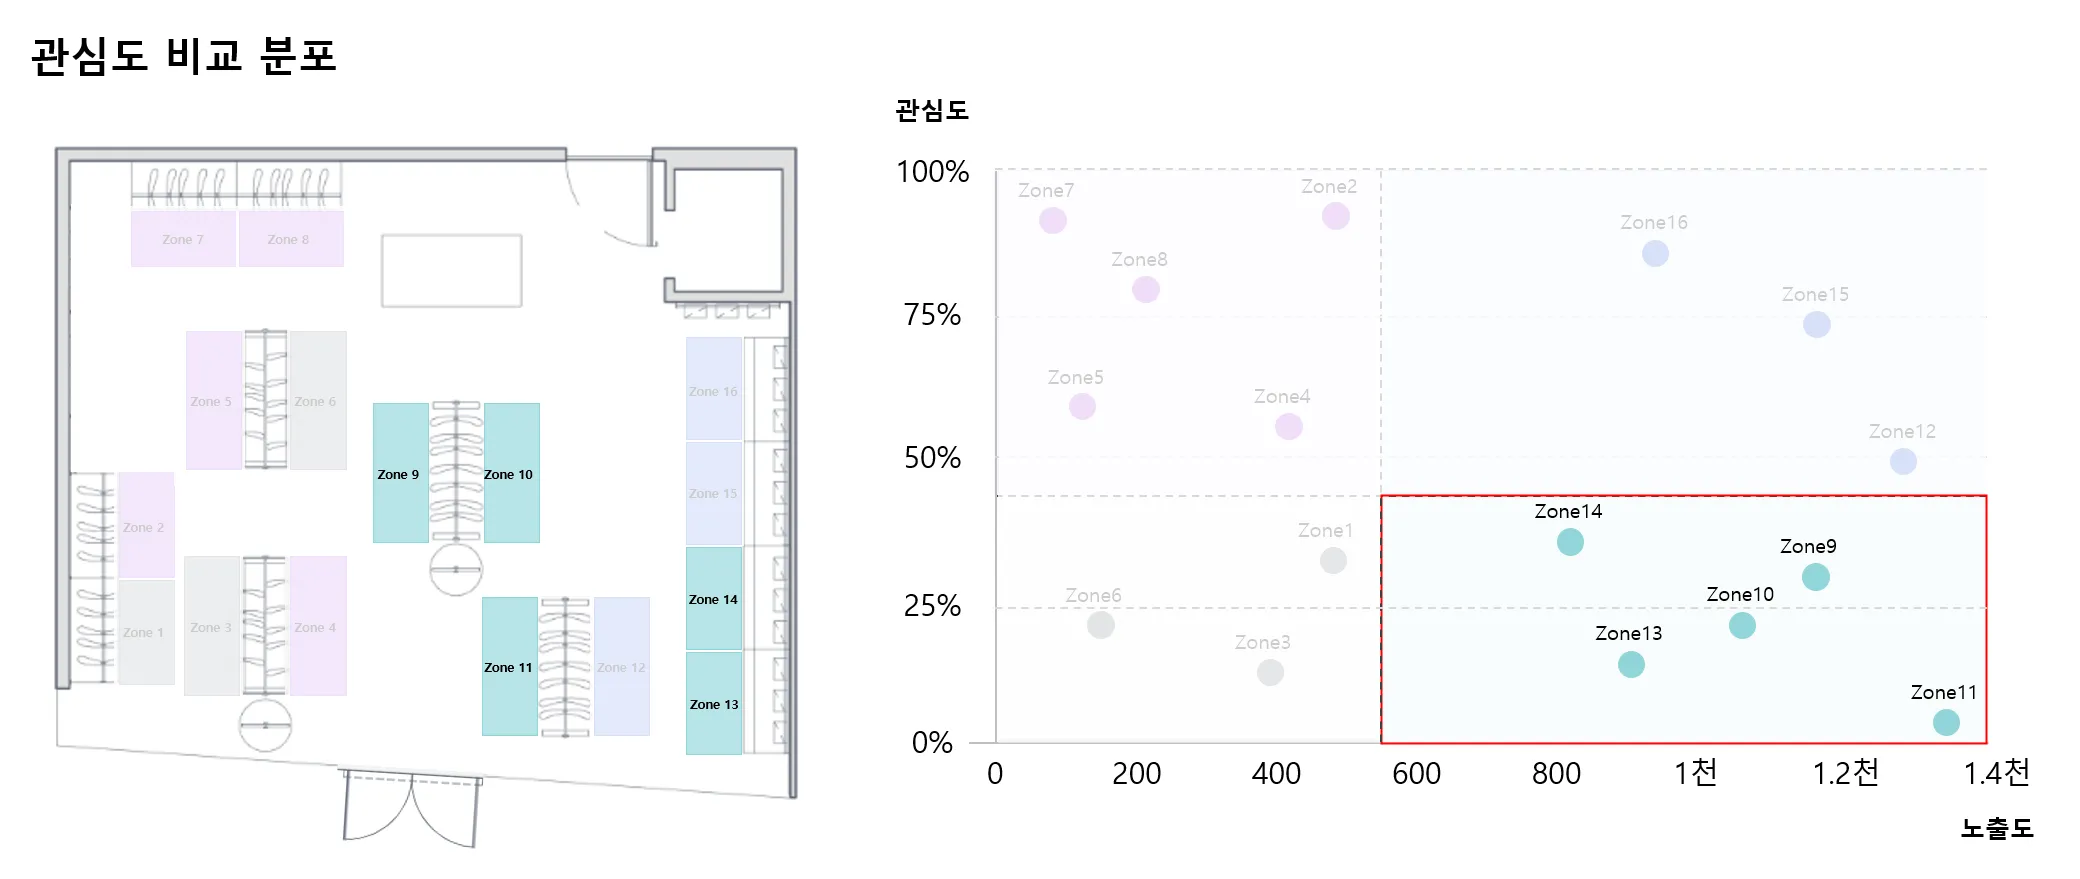
- Characteristics — A great location with plenty of passersby, but no one stops. A “lost opportunity” zone.
- Diagnosis — Located near the entrance or a main path, exposure is guaranteed, but the merchandise fails to meet expectations or the area reads as a pass-through corridor. The first hook for customer attention is missing.
- Strategic actions
- Boost visual appeal — Overhaul VMD (display style), then use eye-catching lighting, colors, and POP to make customers stop.
- Restructure the assortment — Check whether products mismatch customer expectations. Add impulse-purchase value items, trendy products, and seasonal goods to invite exploration.
- Provide guidance — Use clear callouts like “TOP 5” or “MD’s PICK” so customers can browse without overthinking.
Question Mark Zones — Low exposure & Low interest
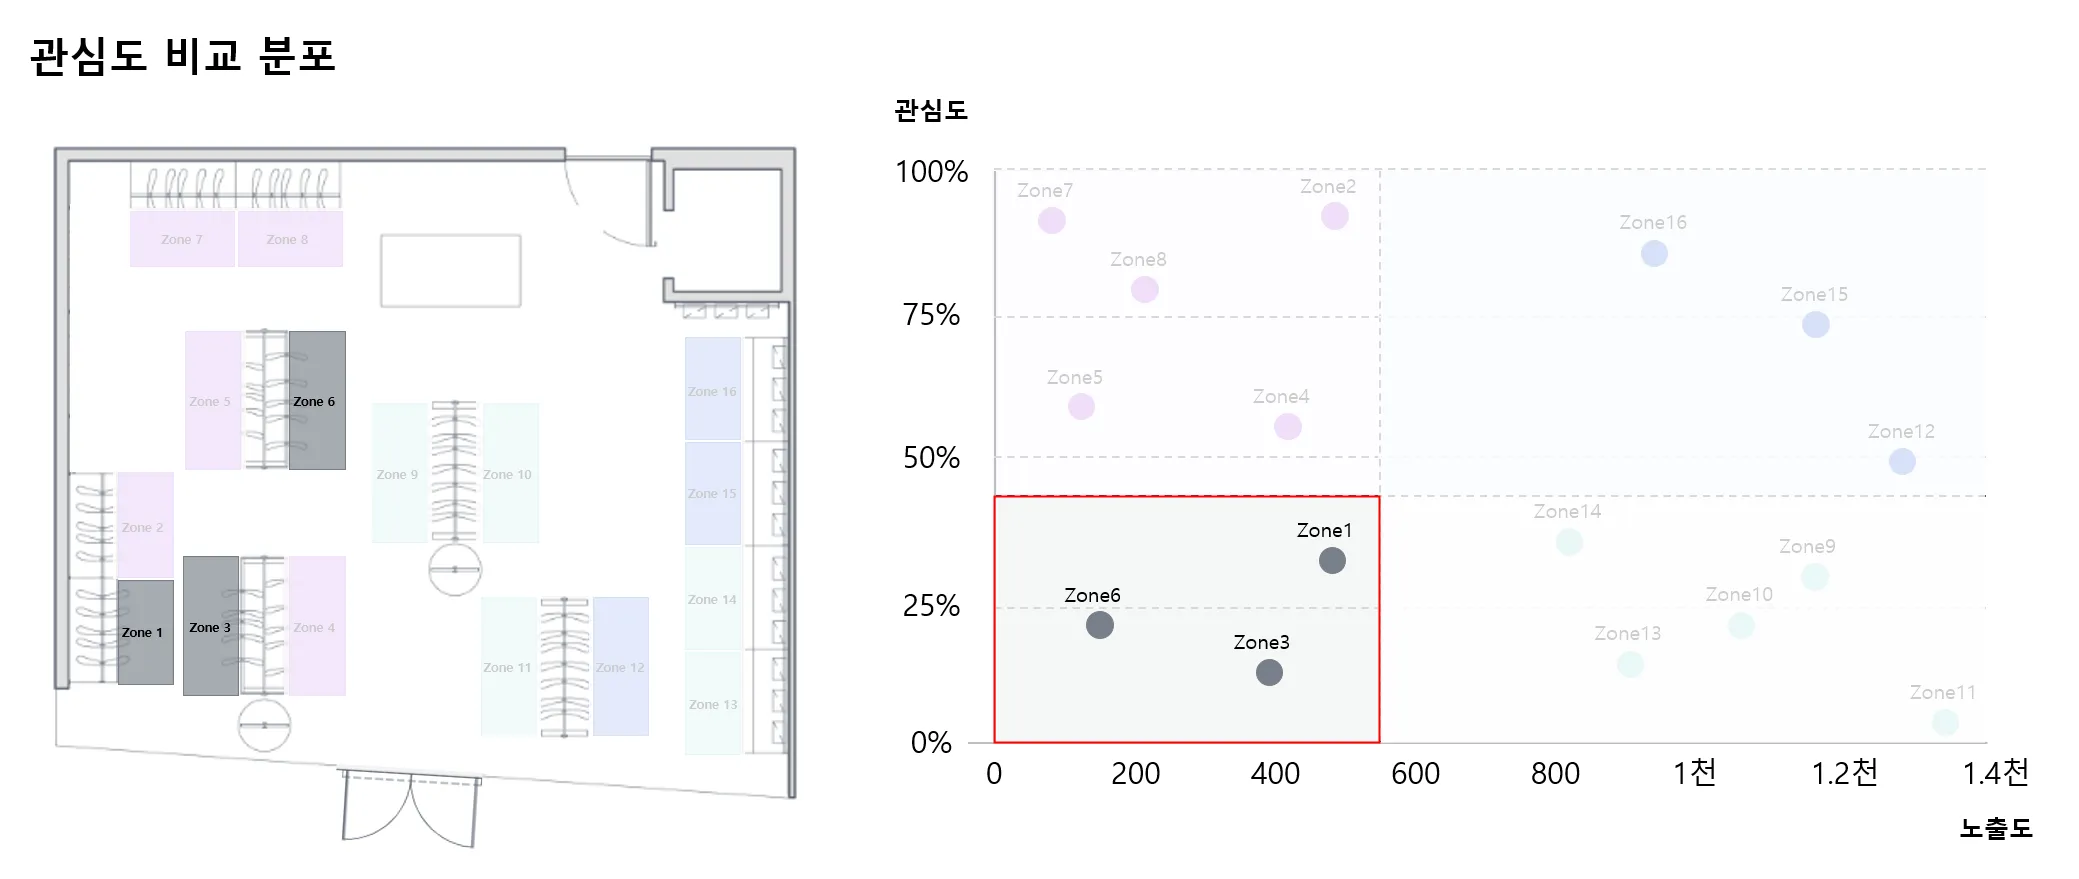
- Characteristics — Few visitors, low dwell — an “underperforming or low-involvement” zone.
- Diagnosis — Two possibilities:
- The zone may hold low-involvement essentials that customers grab quickly without thought. (Revenue might still be acceptable.)
- Or, both accessibility and product appeal are weak, leaving it ignored — a true underperformer.
- Strategic actions
- (For low-involvement products) — Optimize paths so customers find them faster, and place other promotional items along the way to drive cross-selling.
- (For underperforming zones) — Make a bold change. Convert the space into storage, a “loss-leader zone” stacked with steep discounts, or a “pop-up / experimental zone” with a new concept that gives the space a renewed purpose.

Use cases
Precise diagnosis and risk detection
- Move beyond visit counts alone — incorporate dwell rate for a multidimensional view of spatial performance.
- Detect Leaky Buckets early to prevent wasted marketing and operations spend.
Product strategy optimization
- Build display, pricing, and promotion strategies tuned to each zone type (Star, Leaky Bucket, etc.).
- Strengthen Star Zones and shore up Leaky Buckets to improve traffic flow and merchandising efficiency.
Discovering growth opportunities
- Surface Hidden Gems and drive traffic to them to maximize space utilization.
- Establish a strategic case for lifting customer satisfaction and revenue at the same time.
Before-and-after comparison
- Compare zone-type shifts (quadrant positions) before and after renewals, VMD changes, or campaigns to validate strategic impact.
- Objectively measure whether your strategy moved each zone in the intended direction.
Segment-level analysis
- Compare how exposure and interest differ across audiences such as 20-something women vs. 40-something men.
- Apply the findings to segment-specific merchandising and targeted campaigns.
Linked analysis
- Hidden Gems → Use heatmap analysis to confirm exact dwell coordinates.
- Leaky Buckets → Use inter-zone traffic analysis to understand why and how customers exited, and trace inflow paths.
- Connect representative paths and purchase conversion to tie zone-level strategy back to its revenue contribution.