Heatmap analysis
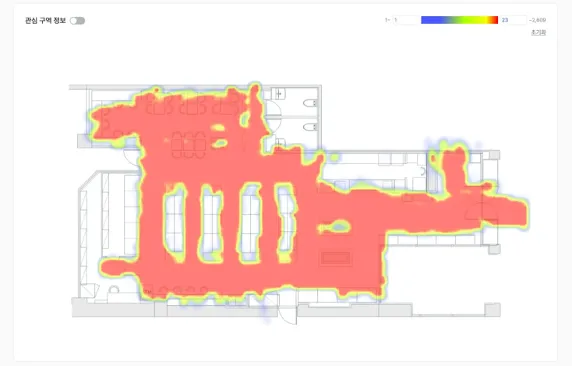
Heatmap analysis visualizes the visit, dwelling, and pickup data of customers using color. Instead of complex numbers, color alone lets you intuitively grasp customer concentration and the zones drawing interest.
- Red marks zones with concentrated activity (Hot); blue marks inactive zones (Cold).
Report layout
Color-based visualization
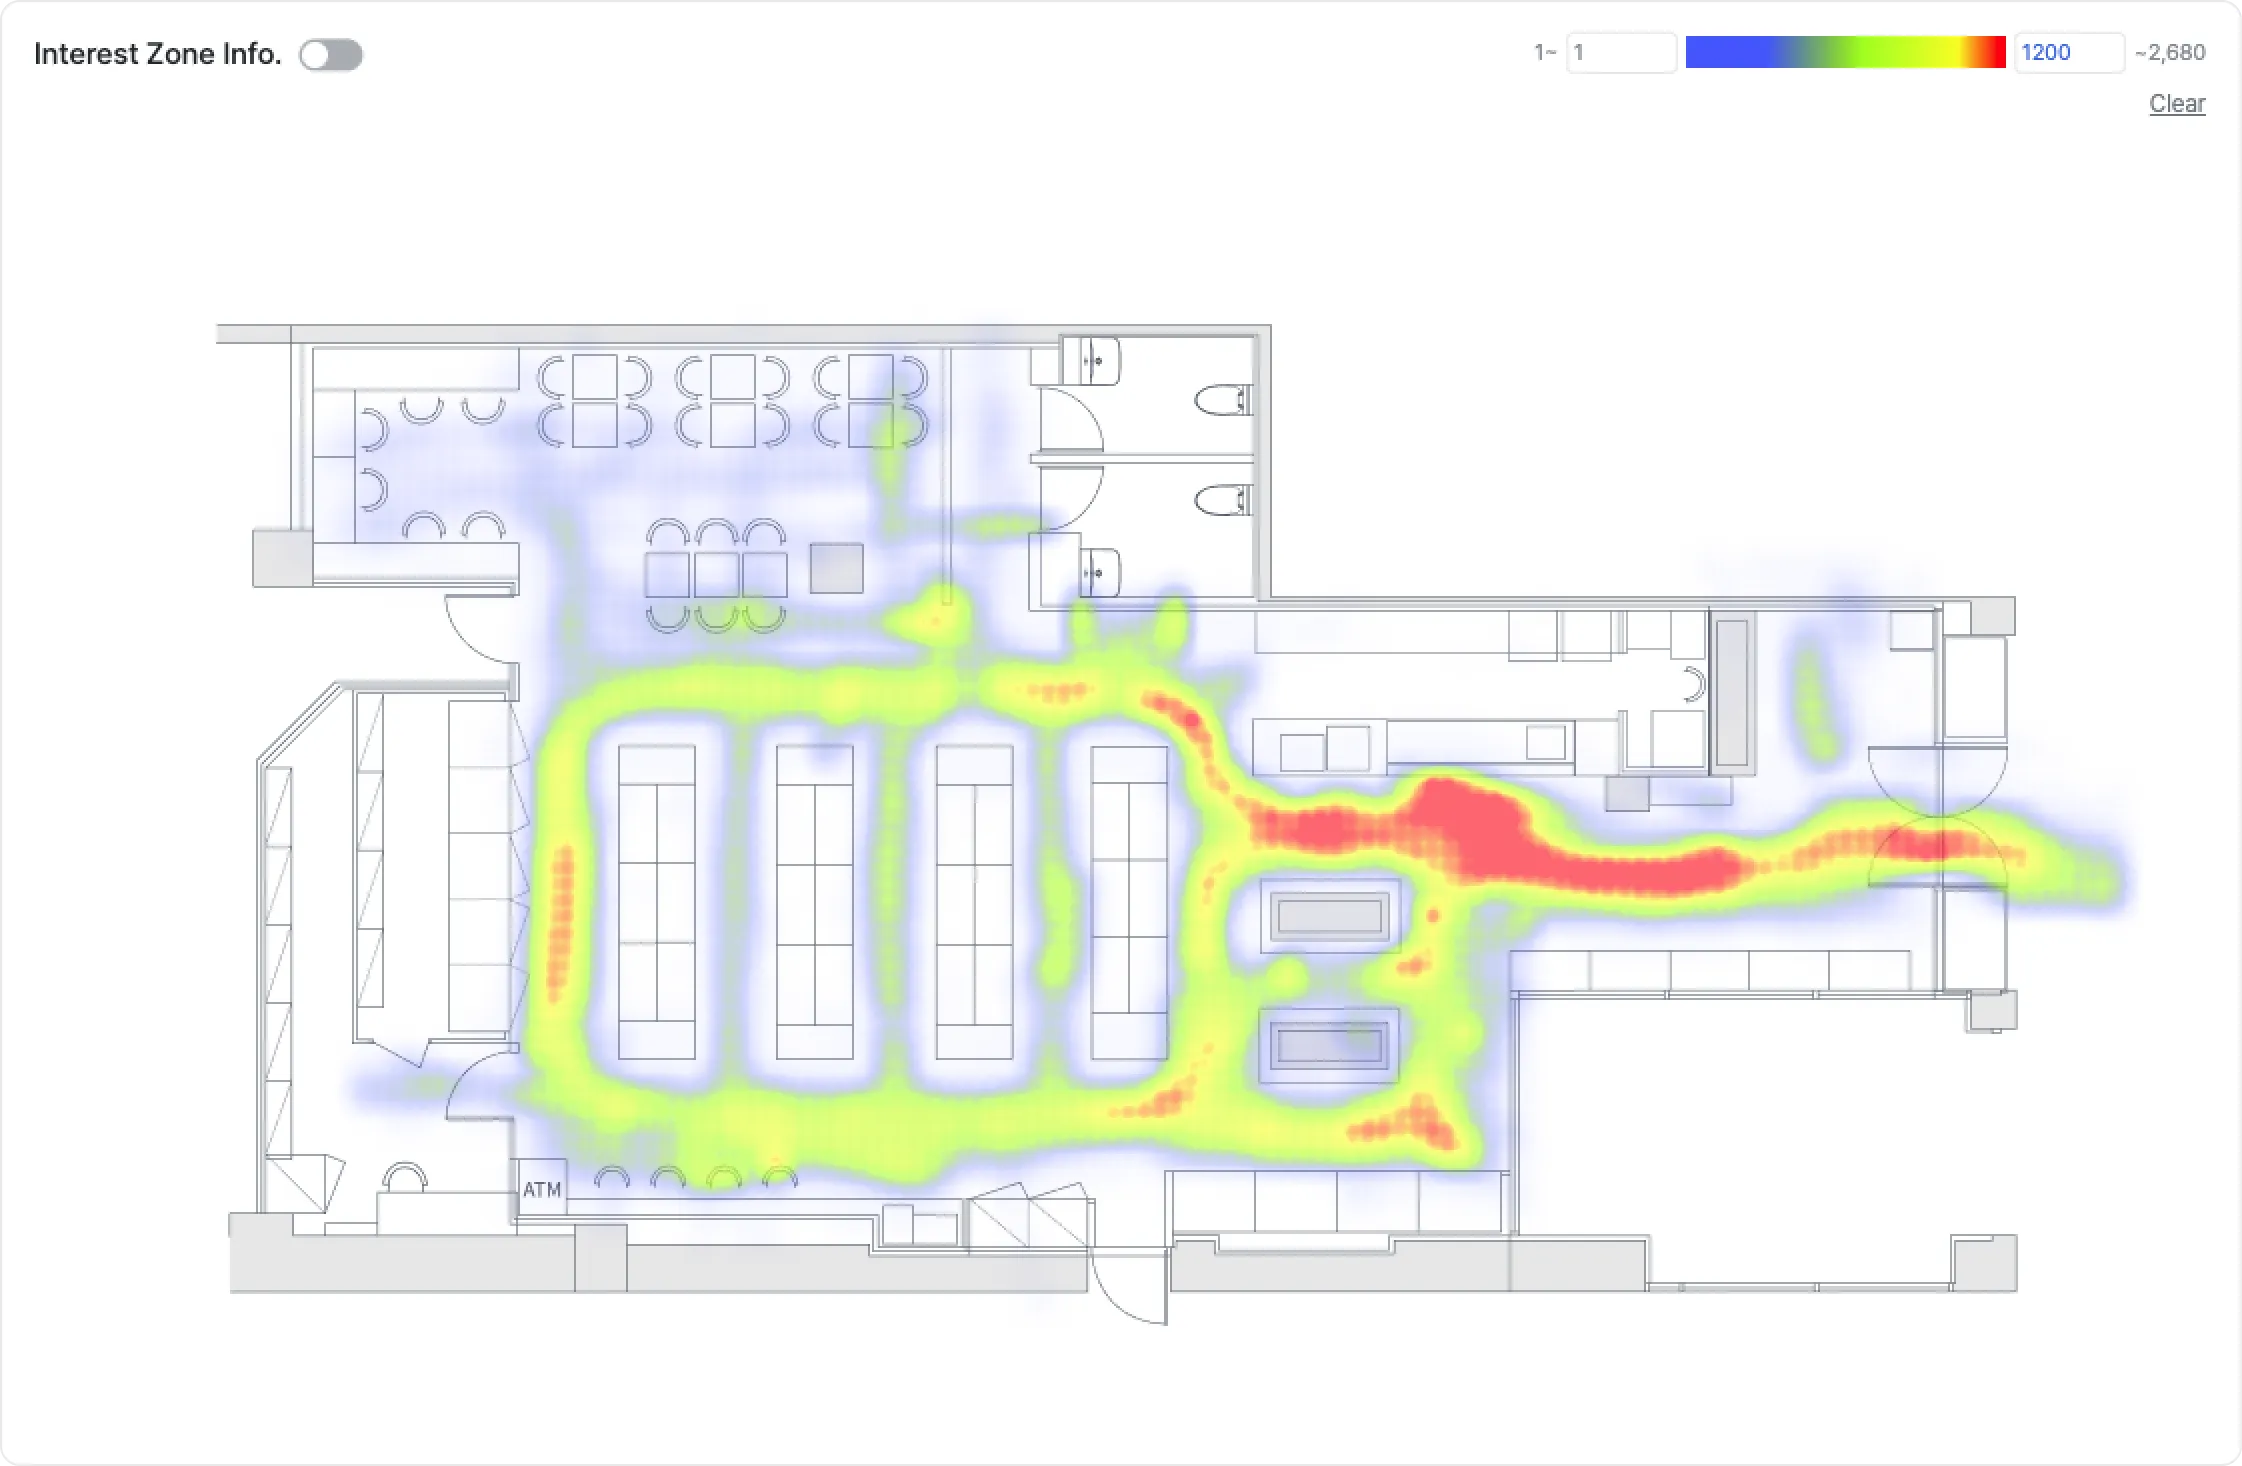
- Customer movement and behavior data are aggregated by coordinate, then converted into colors based on activity level and overlaid on the store floor plan.
- Red indicates high-activity zones; blue indicates low-activity zones.
Examples
- Diagnose space utilization performance intuitively from color alone, no numbers required.
- Identify the spots that attract customer visits and attention from color differences.
Core analysis criteria and use
| Heatmap type | What it analyzes | How to use it |
|---|---|---|
| Visit | Zones customers passed through often | Map path flow, find bottlenecks, evaluate layout efficiency |
| Stay | Zones customers stayed in for a long time | Identify zones of interest; check how well merchandise and signage communicate |
| Pick-up | The actual locations where customers grasped a product | Validate the real impact of placement; identify zones where potential purchase conversions occur |
Expected outcomes
Sales-driven shelf rearrangement
- High dwell, low pickup:
- Diagnose as a failed conversion zone where customers showed interest (dwell) but did not ultimately grab the product (pickup).
- Look for improvement points such as price, description, or staff service.
- High pickup, low sales:
- Investigate why customers abandon purchase after picking up — checkout queues or final-stage display issues, for example.
Space optimization
- Spot inactive zones (cold zones) on the visit heatmap and diagnose space efficiency.
- Move popular products into cold zones to redistribute customer traffic, or convert those areas into experience, photo, or rest zones.
Operational efficiency
- Use real-time visit heatmaps to detect crowded zones and anticipate risk.
- Pre-staff checkouts or specific event zones to minimize customer wait times and improve the shopping experience.
Use cases
- VMD validation — Visually confirm whether key displays really attract attention and dwell.
- Layout improvement — Redesign paths in zones almost no one visits (cold zones).
- Merchandise interest analysis — Use the pickup heatmap to see which products were physically picked up.
Advanced tips
Before-and-after comparison
- Compare heatmaps before and after layout changes, new VMD, or promotions to visually validate the actual impact.
- Use this to accurately measure changes in customer paths and zones of interest, and to ground the next round of improvements.
Filter by target
- Filter by age and gender to compare, for example, a “women in their 20s” heatmap with a “men in their 40s” heatmap.
- Identify how interest in the same space differs by segment, and design more precise target-tailored merchandising and ad strategies.
Combine with other reports
- Pair with Zone analysis: Tie hot or cold zones from the heatmap into Zone analysis to numerically validate total crossings and average dwell time, quantifying performance.
- Pair with Inter-zone traffic: Use Inter-zone traffic to track inflow paths and drop-off causes that the heatmap cannot show on its own. You can grasp the inflow into a zone or post-purchase drop-off in three dimensions.
- Complete the customer-behavior flow: Integrate heatmap “visit → dwell → pickup” data with other reports to build a three-dimensional view of the entire customer journey and solve problems faster.