Inter-zone traffic
Inter-zone traffic analysis visualizes — with arrows — the routes and flows customers take from one zone to another within the store.
It goes beyond how many people entered a single zone: by mapping the routes customers actually follow, you can diagnose how efficiently the path flow works and where customers leave.
- Arrow thickness and color saturation intuitively represent the amount of traffic on that route.
Report layout
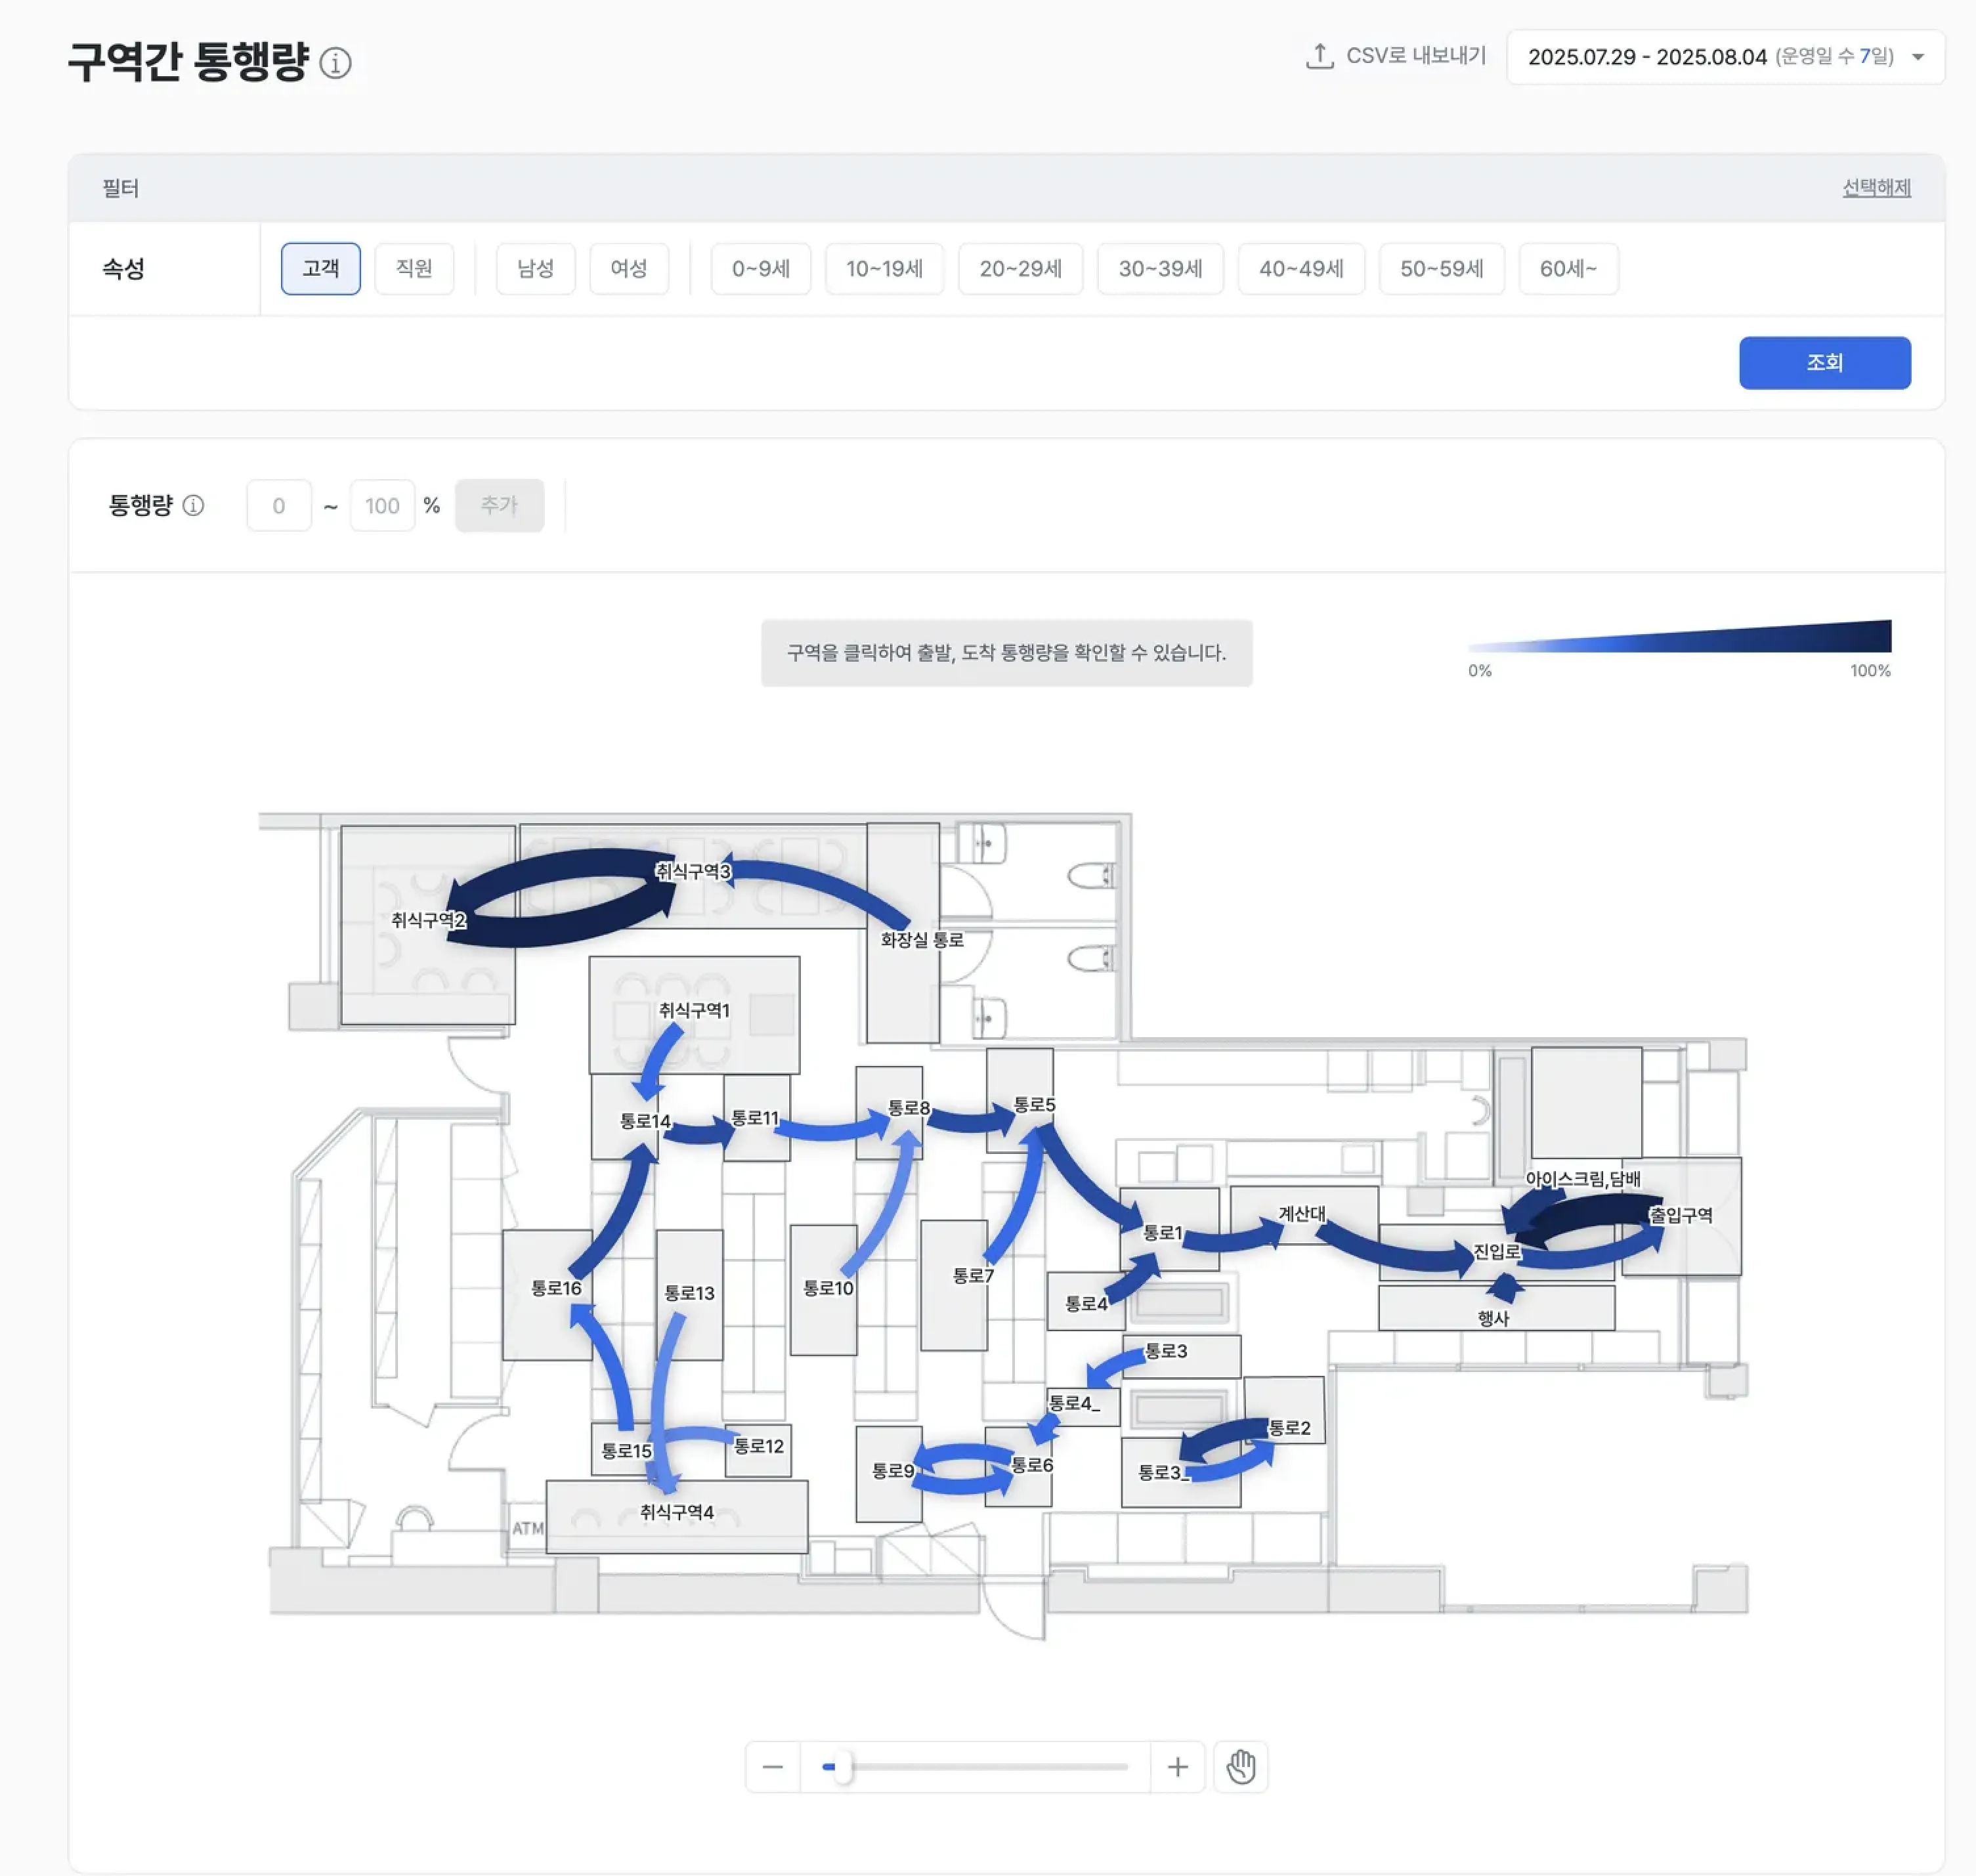
Visualizing inter-zone flow
- Movement direction and traffic volume between defined zones are drawn as arrows on the store map.
- Thicker arrows with deeper colors indicate higher traffic on that route.
Examples
- Confirm whether customer paths concentrate in a specific aisle or zone and predict congestion.
- Diagnose inefficient drop-off routes and plan path improvements.
Detailed origin / destination analysis
- Click a zone to set it as the origin or destination zone.
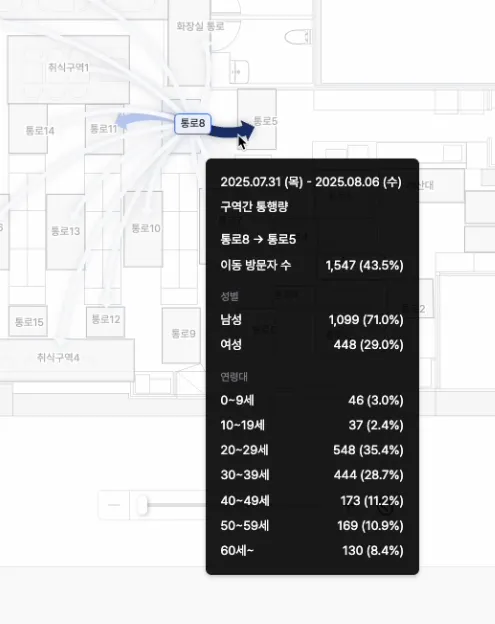
- Click an arrow to view detailed information for that route, including traffic volume and customer distribution.
Examples
- Confirm whether traffic from product-A shelves (origin) to related product-B shelves (destination) is as high as intended, and validate cross-purchase strategies.
- Measure inflow rate to your most strategic zones relative to the entrance to evaluate accessibility.
- Confirm the gender and age distribution of customers using a specific aisle (arrow) and judge whether nearby merchandise or ad messaging fits the target.
Filter traffic by customer segment
- Filter traffic analysis by attributes such as gender, age group, and customer / staff to isolate the movement patterns of a specific customer group.
Examples
- Identify the fast shopping path that women in their 20s take from the “trending corner” to the “self-checkout” and design dedicated services for that segment.
- Exclude staff movement to focus only on pure customer flow and avoid data errors caused by operational activity.
Key metrics (KPIs)
| Metric | Description | Actionable insight |
|---|---|---|
| Total inter-zone traffic | Visitors moving from a specific origin zone to a destination zone within the selected period | Understand absolute traffic on the route and trends over the measurement period |
| Traffic share | Share of this inter-zone route within total traffic | Evaluate the route’s contribution to the core path and its congestion |
| Target traffic distribution | Gender / age-group distribution of customers using a specific route | Validate the target fit of merchandise displayed along the route |
Use cases
Maximize merchandising efficiency
- Validate whether placement of related products translates into actual customer flow.
- Establish core evidence for layout optimization.
Prevent drop-off and bottlenecks
- Identify routes (thin arrows) where customers leave to outside the store or to inactive zones.
- Resolve bottlenecks and improve shopping satisfaction.
Space-utilization strategy
- When inflow into a zone is low, use the data as strategic evidence for improving accessibility or repurposing the zone.
Before-and-after path comparison
- Compare traffic flow before and after layout changes such as shelf relocation or aisle widening.
- Visually validate the change effect through differences in arrow thickness and color.
Detect and diagnose abnormal paths
- Identify traffic that goes straight from the entrance to the exit.
- Diagnose factors that make customers uncomfortable inside the store — long queues, awkward displays — and improve them.