Funnel Analysis
Funnel Analysis quantifies a customer’s journey stage by stage: from passing in front of a shelf (visit), to looking at a product for at least one second (exposure), to looking with intent for at least three seconds (exploration), to actually picking up the product (pickup).
It measures behavioral conversion quantitatively, showing exactly how many customers move from one stage to the next. That makes it easy to pinpoint bottlenecks and prioritize improvements that deliver maximum impact at minimum cost.
Report layout
Custom funnel design
- Provides concrete funnel stages (visit → exposure → exploration → pickup).
- Stages can be combined freely depending on your analytical goal.
Examples
- End-to-end shopping diagnosis — Compose a visit → exposure → pickup funnel to measure the overall flow efficiency from when a customer first sees the shelf to when they pick up a product.
- Focused behavior analysis — Set only the exposure → exploration stages to focus on the deeper engagement rate of customers already interested in the shelf.
- Pre-purchase analysis — Set only the exploration → pickup stages to measure the rate at which highly engaged customers convert into actual purchase behavior.
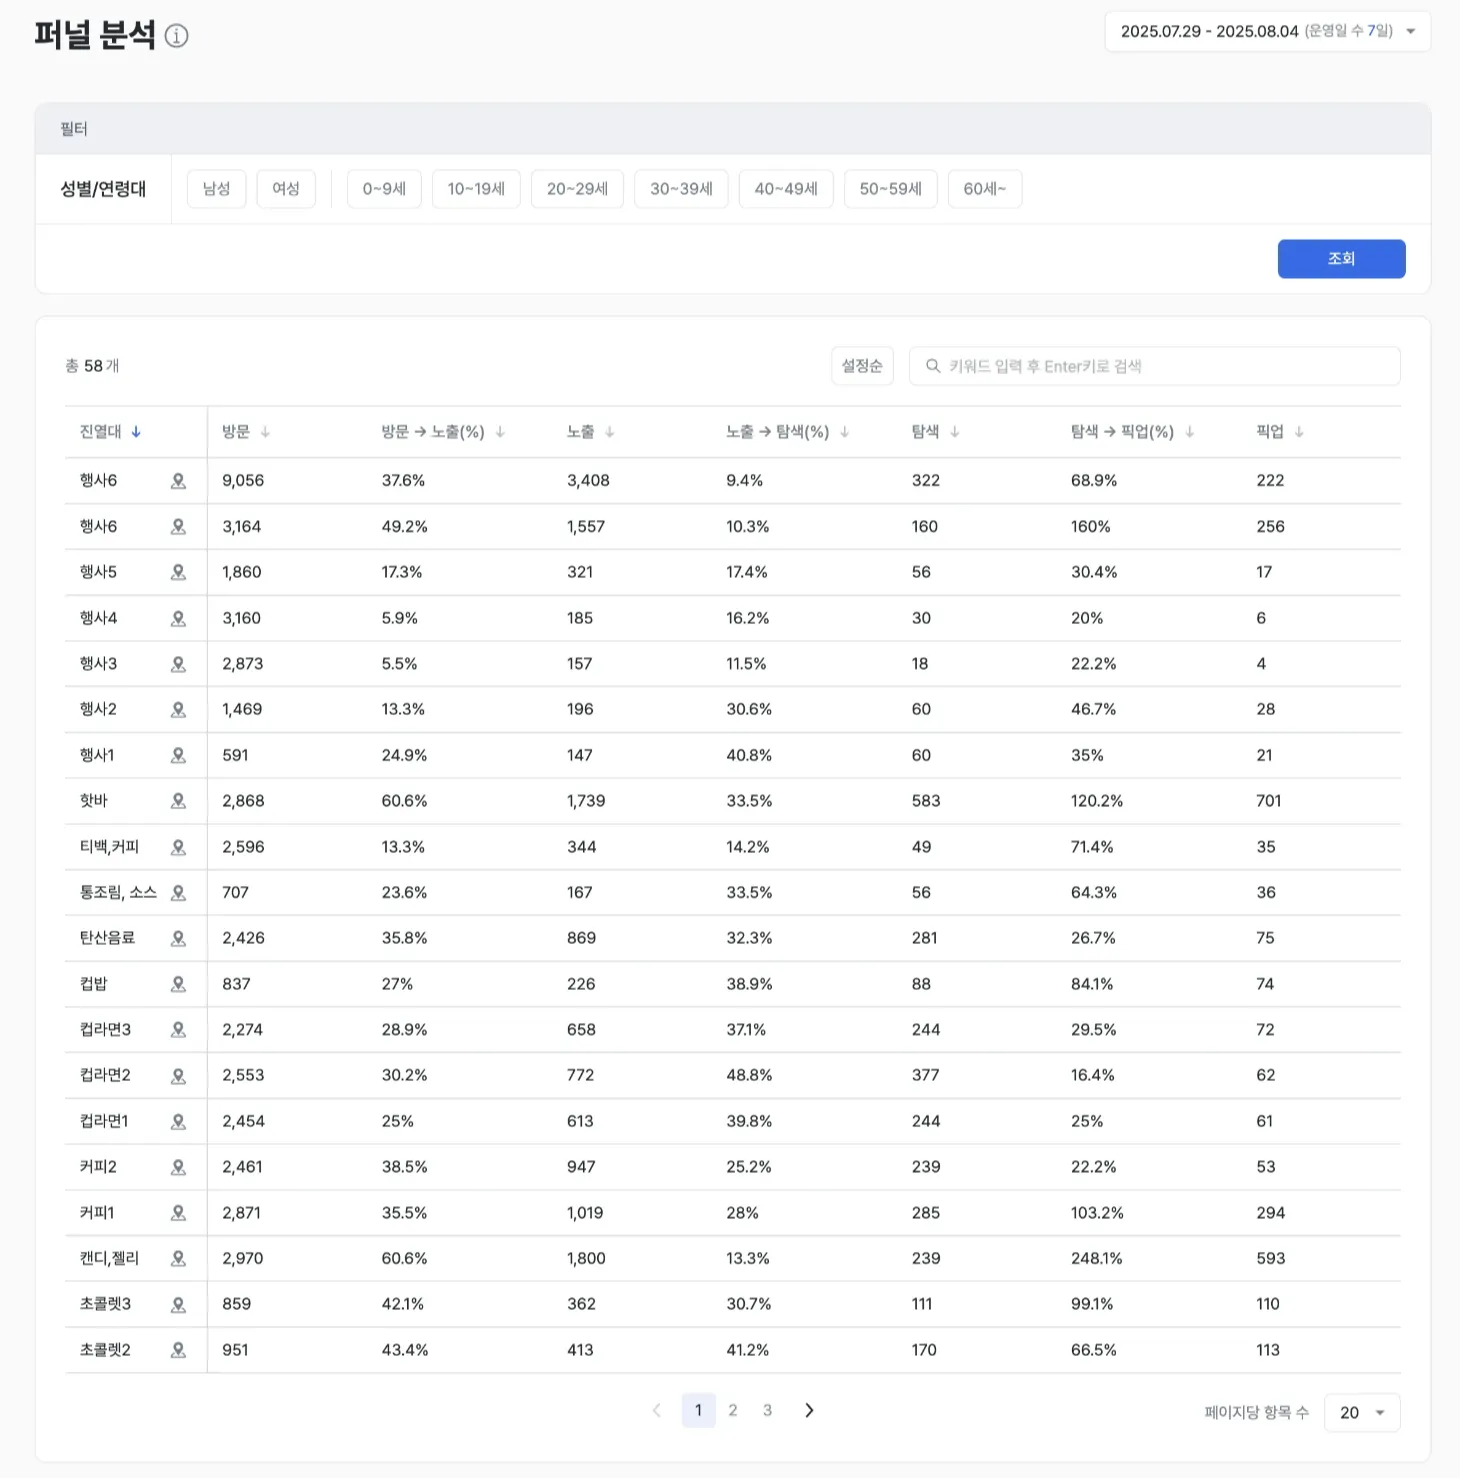
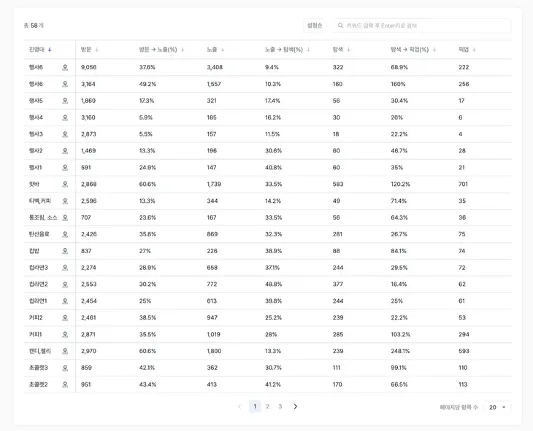
Stage-by-stage drop-off diagnosis
- Provides clear conversion rates and drop-off counts for each stage of the funnel (visit / exposure / exploration / pickup).
- Instantly identifies the bottleneck stage with the lowest conversion and surfaces problem hypotheses to guide your strategy.
| Bottleneck | Hypothesis | Linked analysis |
|---|---|---|
| Low visits | Insufficient entry paths or weak wayfinding | Use traffic and path analysis to inspect entry flow |
| Low exposure relative to visits | Limited assortment or inefficient display (height, lighting, orientation) | Use Zone Interest Analysis to inspect display position and structure |
| Low exploration relative to exposure | Weak product appeal or insufficient information | Compare product info and exposure elements between high and low exploration zones |
| Low pickup relative to exploration | Pricing or product dissatisfaction; last-mile hesitation | Compare pickup vs. actual purchase rate and inspect counter merchandising |
Funnel comparison by segment
- Compare funnel performance by gender and age group to precisely diagnose drop-off causes per group.
- Identify the stage where each target audience drops off most and craft personalized strategies.
Examples
- 20-something women have high exploration but low purchase conversion → Drive purchases with coupons and time-limited promotions.
- 40-something men have few zone visits to begin with → Expand exposure with entrance-leading VMD and concise information.
Use cases
Concentration of resources and prioritization
- Direct staffing and marketing toward the biggest bottleneck to maximize improvement impact.
- Use data to decide the improvement priorities that yield maximum conversion lift at minimum cost.
Conversion improvement and quantitative validation
- Set improvement direction with data, not intuition, to lift conversion.
- Compare funnel conversion before and after each strategy to quantitatively validate A/B test results.
Building an integrated diagnostic framework
- Unify all analyses (heatmap, paths) under a single yardstick — conversion rate — and make it the anchor for strategic execution.
- Define and measure latent behaviors (exposure, exploration) clearly to lay the foundation for future demand forecasting.
Linked-analysis workflow
Funnel Analysis is the conclusion of every analysis and the anchor for strategic execution. The four-step workflow below maximizes synergy across analyses.
- Diagnose — Use Funnel Analysis to identify the largest bottleneck and drop-off stage.
- Observe — Use heatmap and Zone Interest Analysis to confirm specific customer behavior patterns at that stage.
- Trace — Use inter-zone traffic analysis to track drop-off paths and inflow trajectories.
- Execute & validate — After running the improvement, use Funnel Analysis again to verify conversion changes.
Custom-stage applications
- Reflect your unique business logic by breaking funnel stages down further (e.g., tasting station → pickup).
- Build funnels for a single product category (e.g., frozen foods) to design category-specific merchandising strategies.