Event Schedule Report
Prerequisites
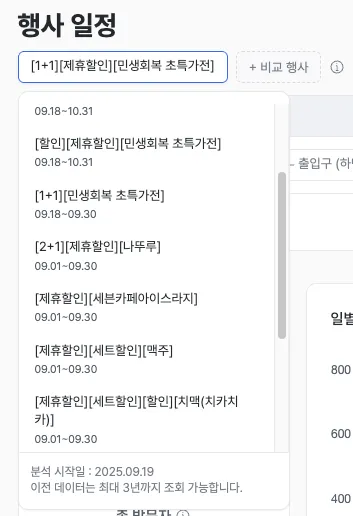
- Google Calendar must be connected under Event schedule management.
Report layout
The event schedule report precisely analyzes inflow and demographic response per event held in the store. Find out which audiences responded most to which events and visited, then use the data to optimize your event strategy.
Core features
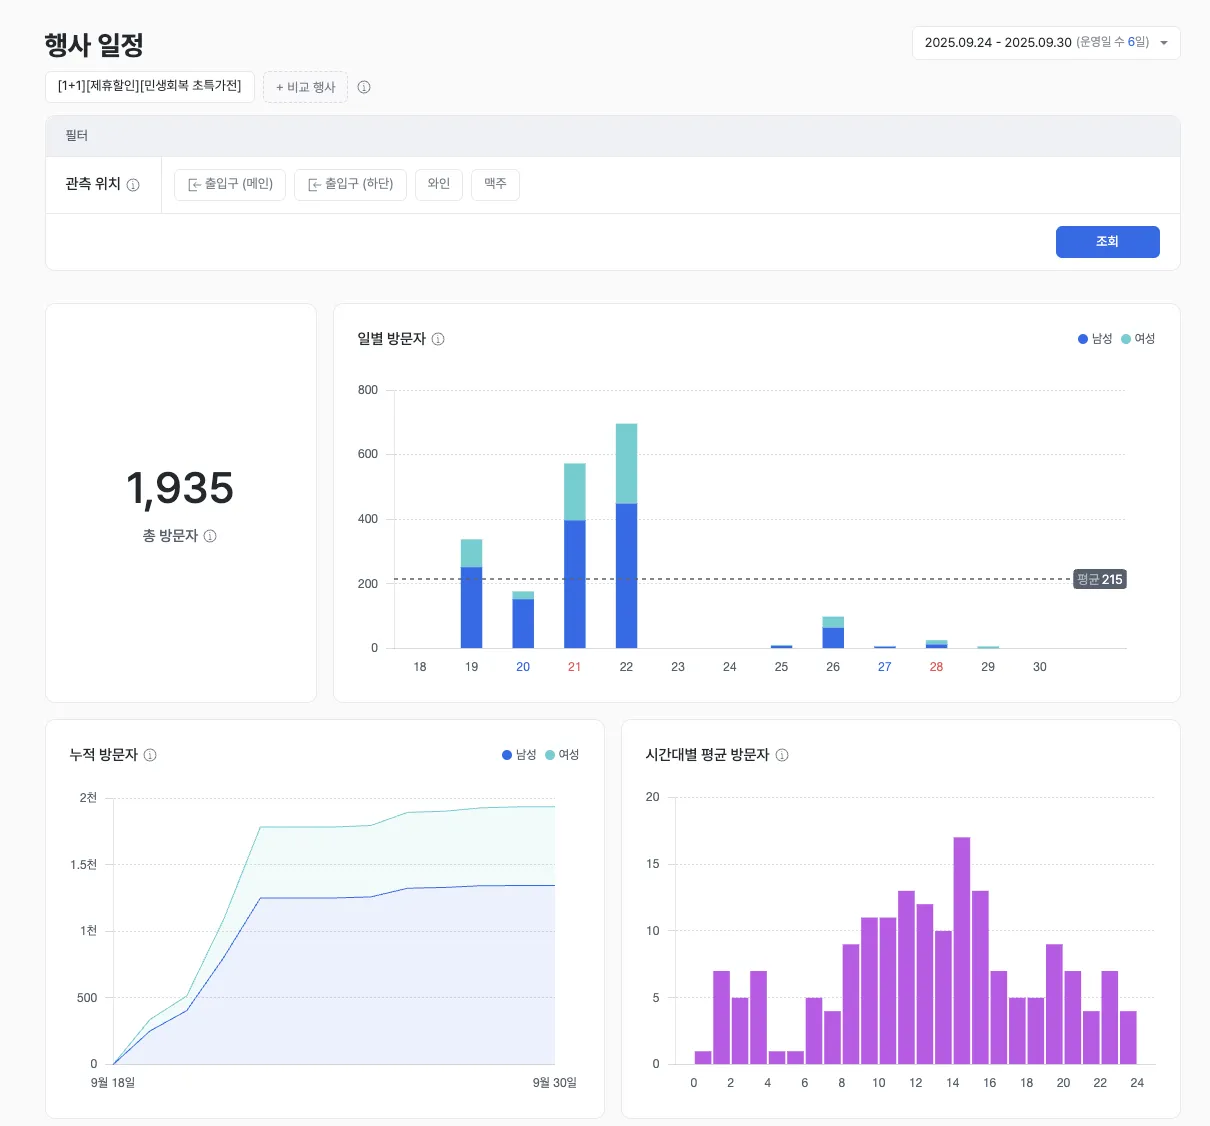
Event visitor stats
- Aggregates inflow and behavior data over the selected event period.
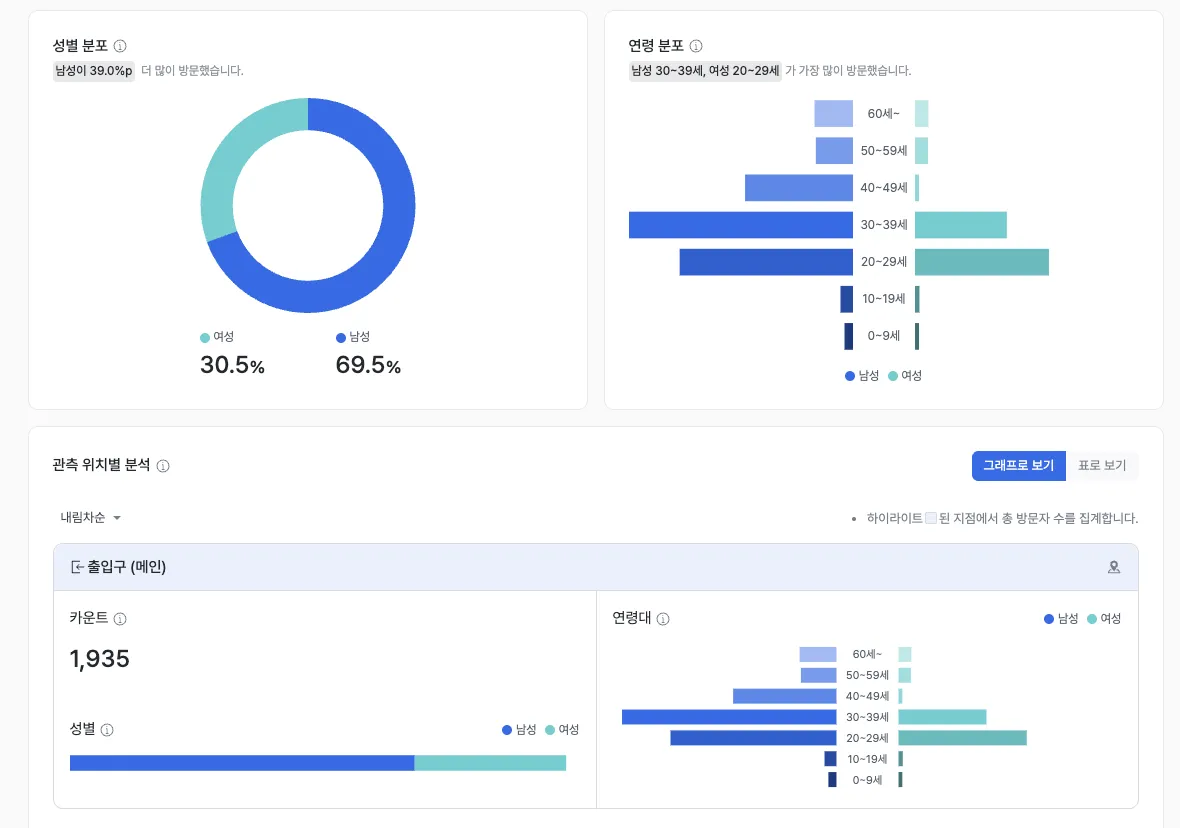
- Provides the core baseline statistics: total visitors, daily / hourly inflow trends, and gender / age distribution.
Examples
- Use hourly visitor counts to optimize staffing and inventory placement.
- Use the gender and age distribution to feed the next event’s planning.
Event performance comparison
- Compare core metrics across up to two events selected within the operating period.
- Measure relative performance based on total visitors and customer-response data for the two events.
Examples
- Compare inflow impact across promotion types — “discount” vs. “free gift.”
- Compare event visitors with visitors to your core product corner.
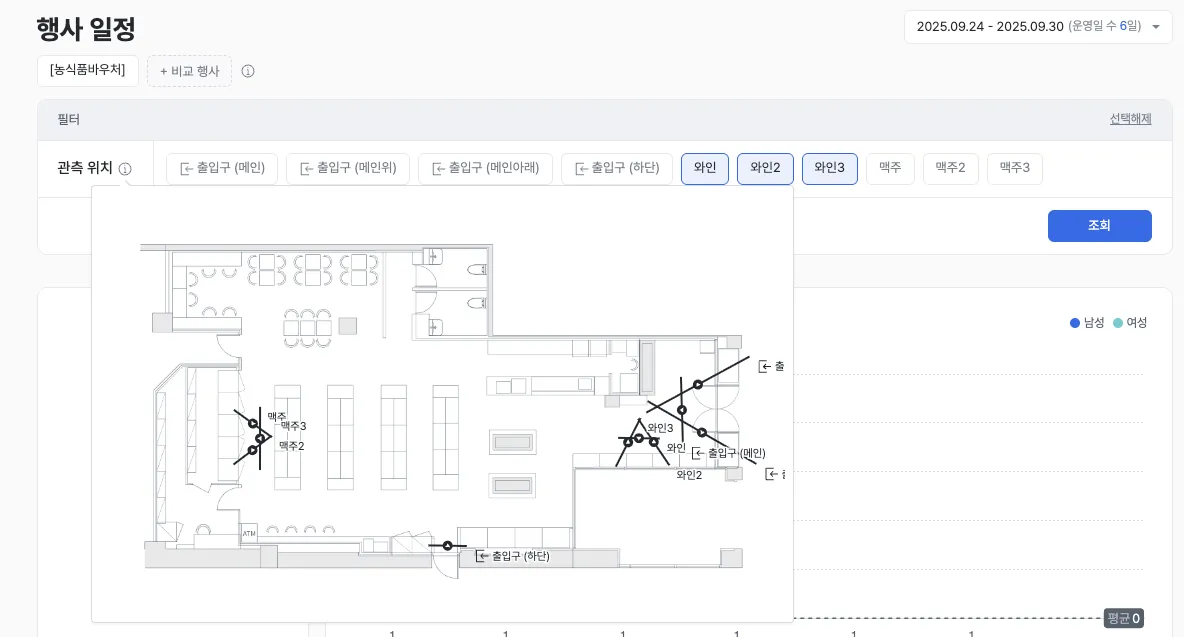
Observation-point entry analysis
- After picking an event, designate a specific “observation point” inside the store to drill down further.
- Analyze entry stats and demographics for customers who visited that point during the event.
Examples
- Identify the gender and age group of customers near POP / signage observation points.
- Measure how an event affected inflow into specific spaces such as core product corners.
Key metrics (KPIs)
| Metric | Description | Insight |
|---|---|---|
| Total visitors | The full audience size drawn by the event | Gauge attraction power and early performance |
| Demographic distribution | Gender and age-range mix of visitors | Confirm fit with the target audience |
| Time-of-day concentration | Peak hours with the heaviest inflow | Improve staffing and inventory placement |
| Cross-event performance | Differences in total visitors and inflow efficiency between events | Choose the optimal promotion type |
| Observation-point inflow rate | Share of customers who visited an event touchpoint (POP, display) | Measure the real impact of event displays |
Use cases
Maximize marketing ROI
- Lock in optimal attraction tactics by analyzing the success factors of winning events.
- Use comparative analysis to remove inefficient marketing components.
- Minimize budget waste and lift marketing-investment efficiency.
Improve marketing-targeting accuracy
- Refine targeting for the next event based on which audiences actually responded.
- Run personalized marketing using each group’s preferred event types.
Improve operations and customer experience
- Forecast time-of-day congestion to optimize staffing and inventory placement.
- Maximize the impact of event touchpoints (displays, POP) using observation-point analysis.
- Reduce drop-off and improve the shopping experience through better congestion management.
Advanced tips
Summary
Event analysis is a tool for quantitatively comparing inflow performance and customer response across store events. Use it to measure event efficiency with data and optimize next-event planning and store operations.