

Status tab
The Status tab shows at a glance whether the analysis device is running normally. The screen refreshes automatically, so it always reflects the current state.
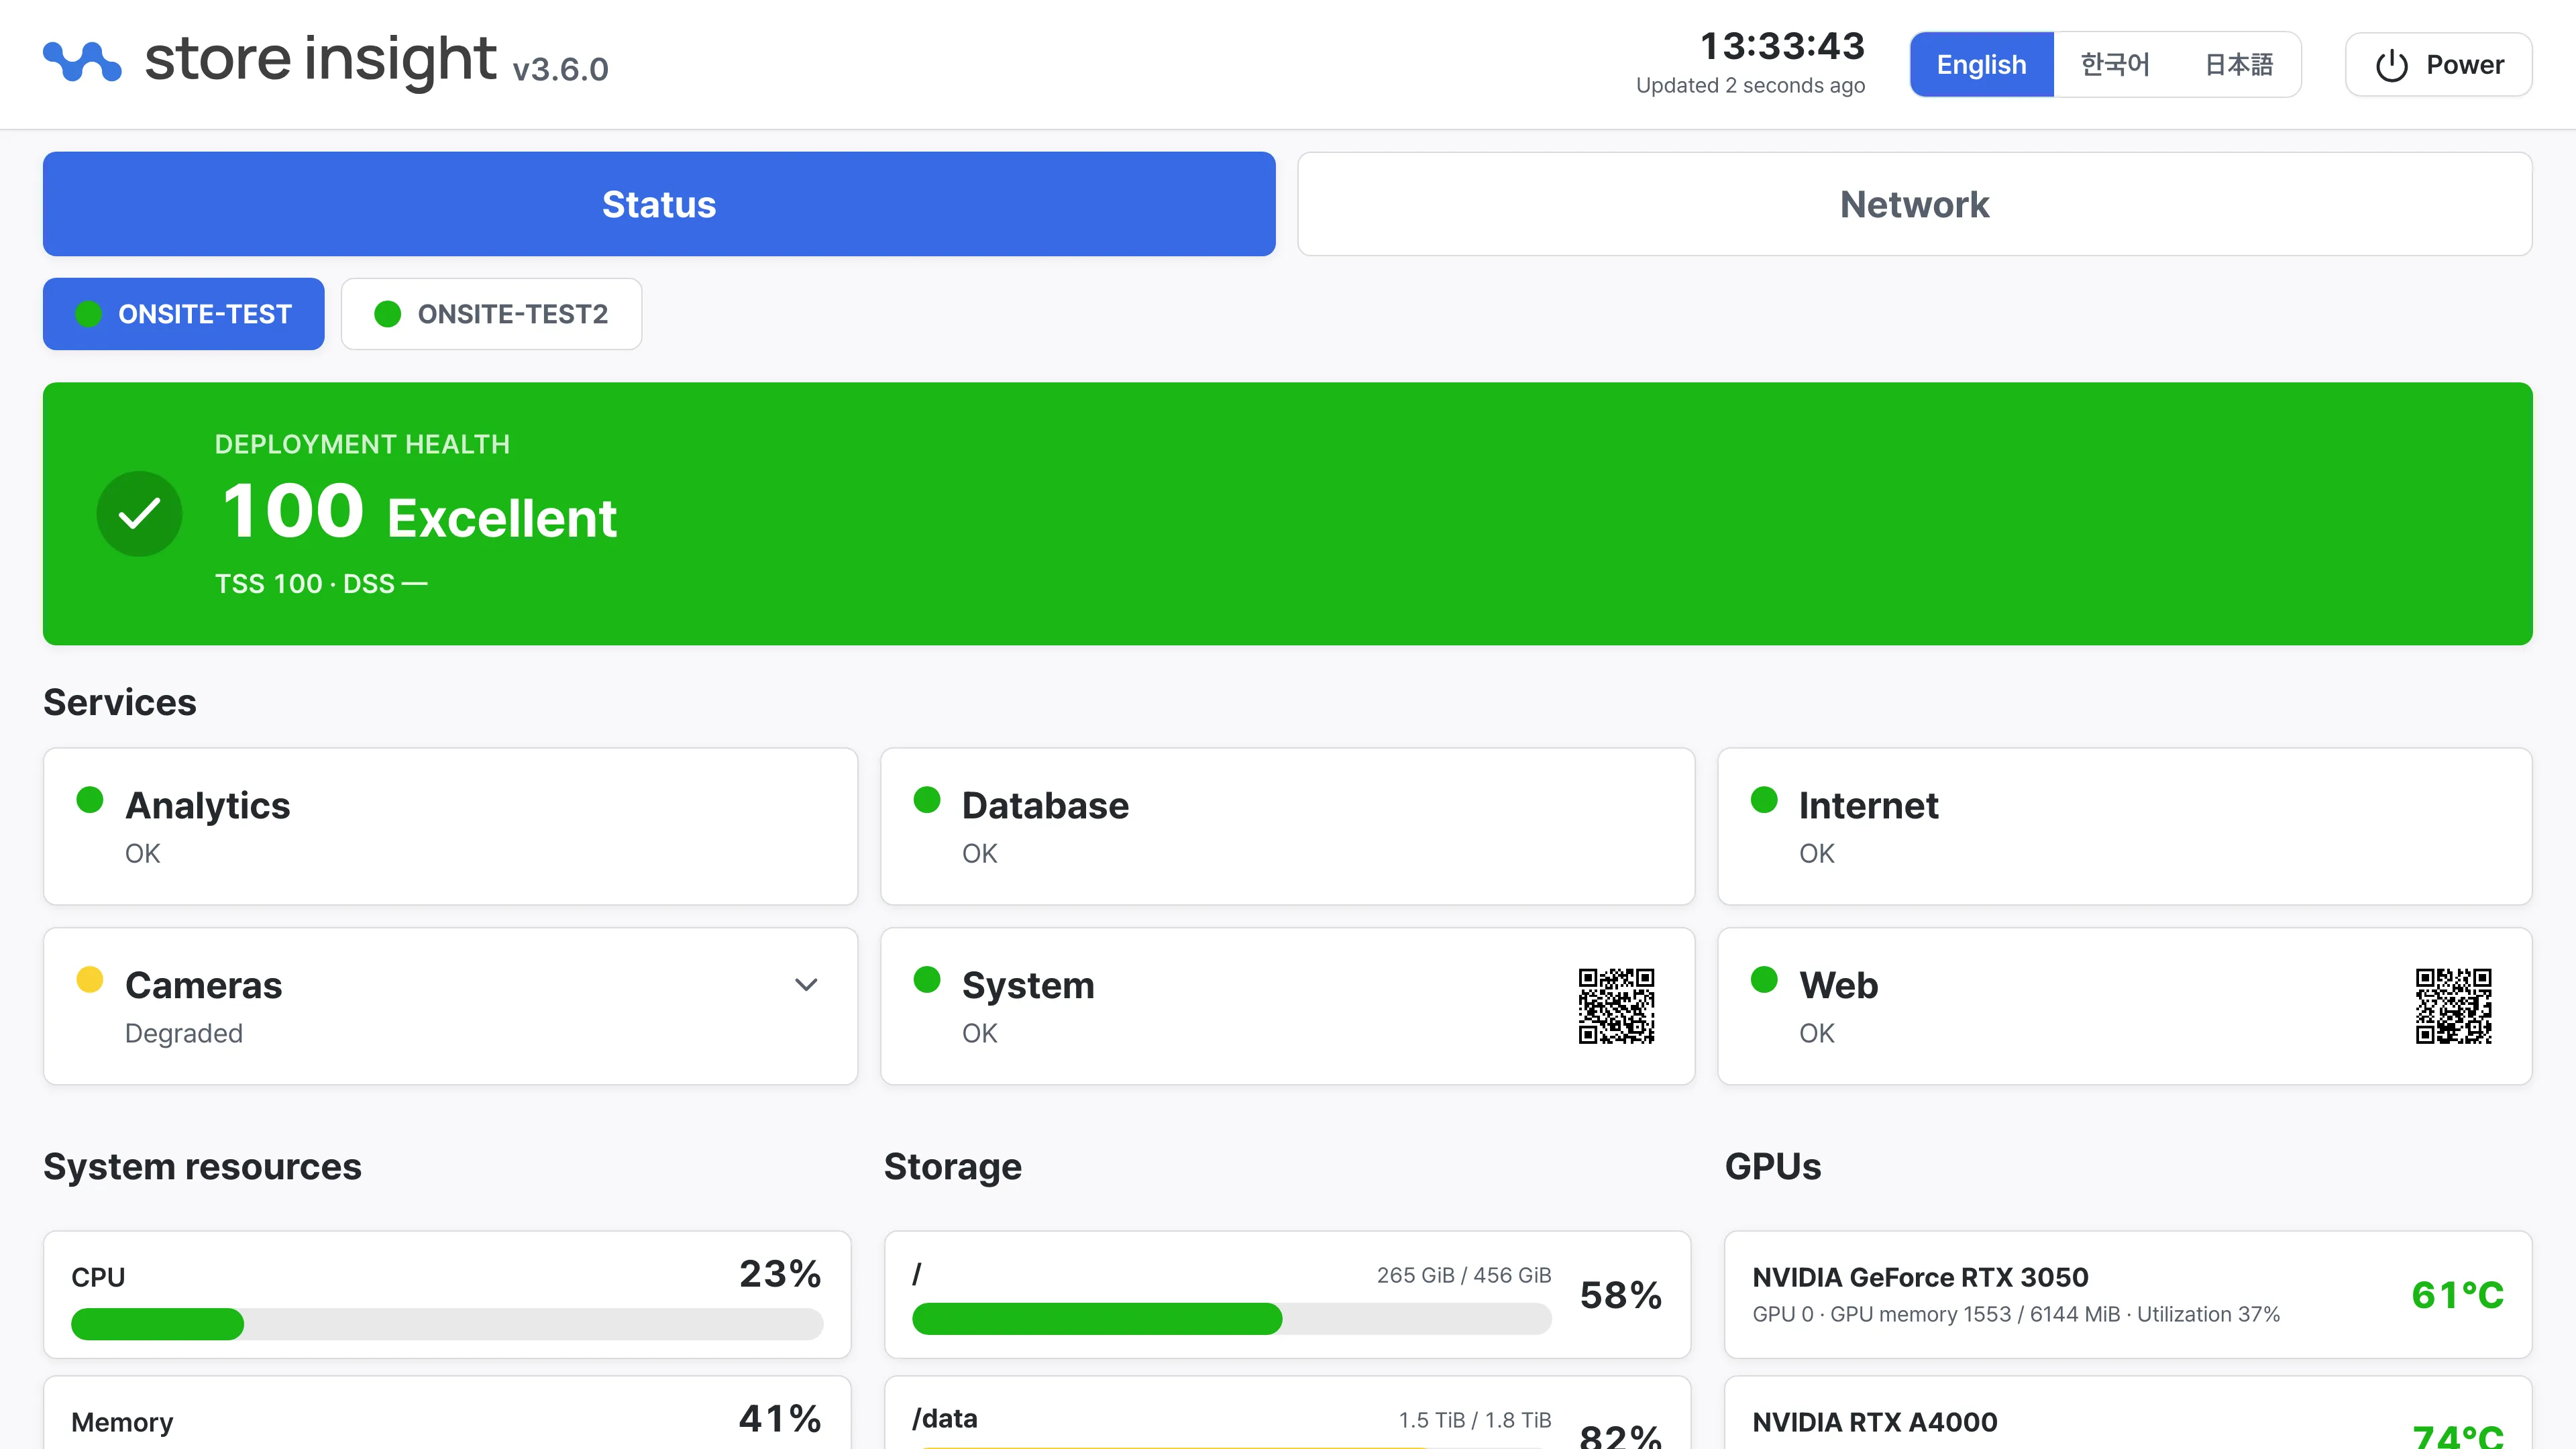
Per-site tabs
When one device runs several installations (stores), tabs for each site appear near the top of the screen. Each tab carries a colored dot with that site’s overall state, and tapping a tab switches the view. With a single installation, only one tab is shown.
Deployment Health
The large banner summarizes the selected site’s overall health as a score from 0 to 100. A rating is shown next to the score, and the banner color also reflects the state.
| Score | Rating | Meaning |
|---|---|---|
| 95–100 | Excellent | Everything is normal. No action needed. |
| 85–94 | Healthy | Within the normal range. No particular action needed. |
| 70–84 | Degraded | Some functions are not running smoothly. Keep an eye on the state. |
| 50–69 | Unhealthy | A problem has occurred. Inspection is needed. |
| 0–49 | Critical | Immediate action is required. |
Besides the score, two other indicators may appear.
- Indeterminate — The score could not be computed. If this persists, check the network connection and the device.
- Closed — The store is outside its operating hours, so video analysis is intentionally stopped. This is not a problem; analysis resumes automatically when operating hours begin.
TSS and DSS
Two sub-scores appear below the main score.
- TSS (Technical Stability Score) — How stably the device and its services are running.
- DSS (Data Stability Score) — How stable the quality of the collected analysis data is.
A value that has not been computed yet, or cannot be determined, is shown as —.
Capped by
When a serious problem is detected, the overall score is automatically capped and the banner shows the Capped by reason. If a capped state persists, please contact the Deeping Source technical team.
Services
The services running for the selected site are grouped into six areas.
| Service | What it covers |
|---|---|
| Analytics | The video-analysis engine that produces visitor paths and statistics |
| Database | The data store where analysis results are kept |
| Internet | The device’s outbound internet connectivity |
| Cameras | Receiving and processing camera video |
| System | The device’s basic system services |
| Web | The dashboard screens and access services |
Each service card shows a colored dot together with a status label.
- OK (green) — The service is running normally.
- Degraded (yellow) — Running, but some functions are not smooth.
- Down (red) — The service has stopped.
- Unknown (gray) — The state could not be determined.
Some cards carry a QR code. When that area has a problem, scanning the code with a phone opens the matching troubleshooting guide directly.
View video
Tapping the Cameras card expands it: a View video area appears below, showing the selected site’s registered cameras as picture tiles.
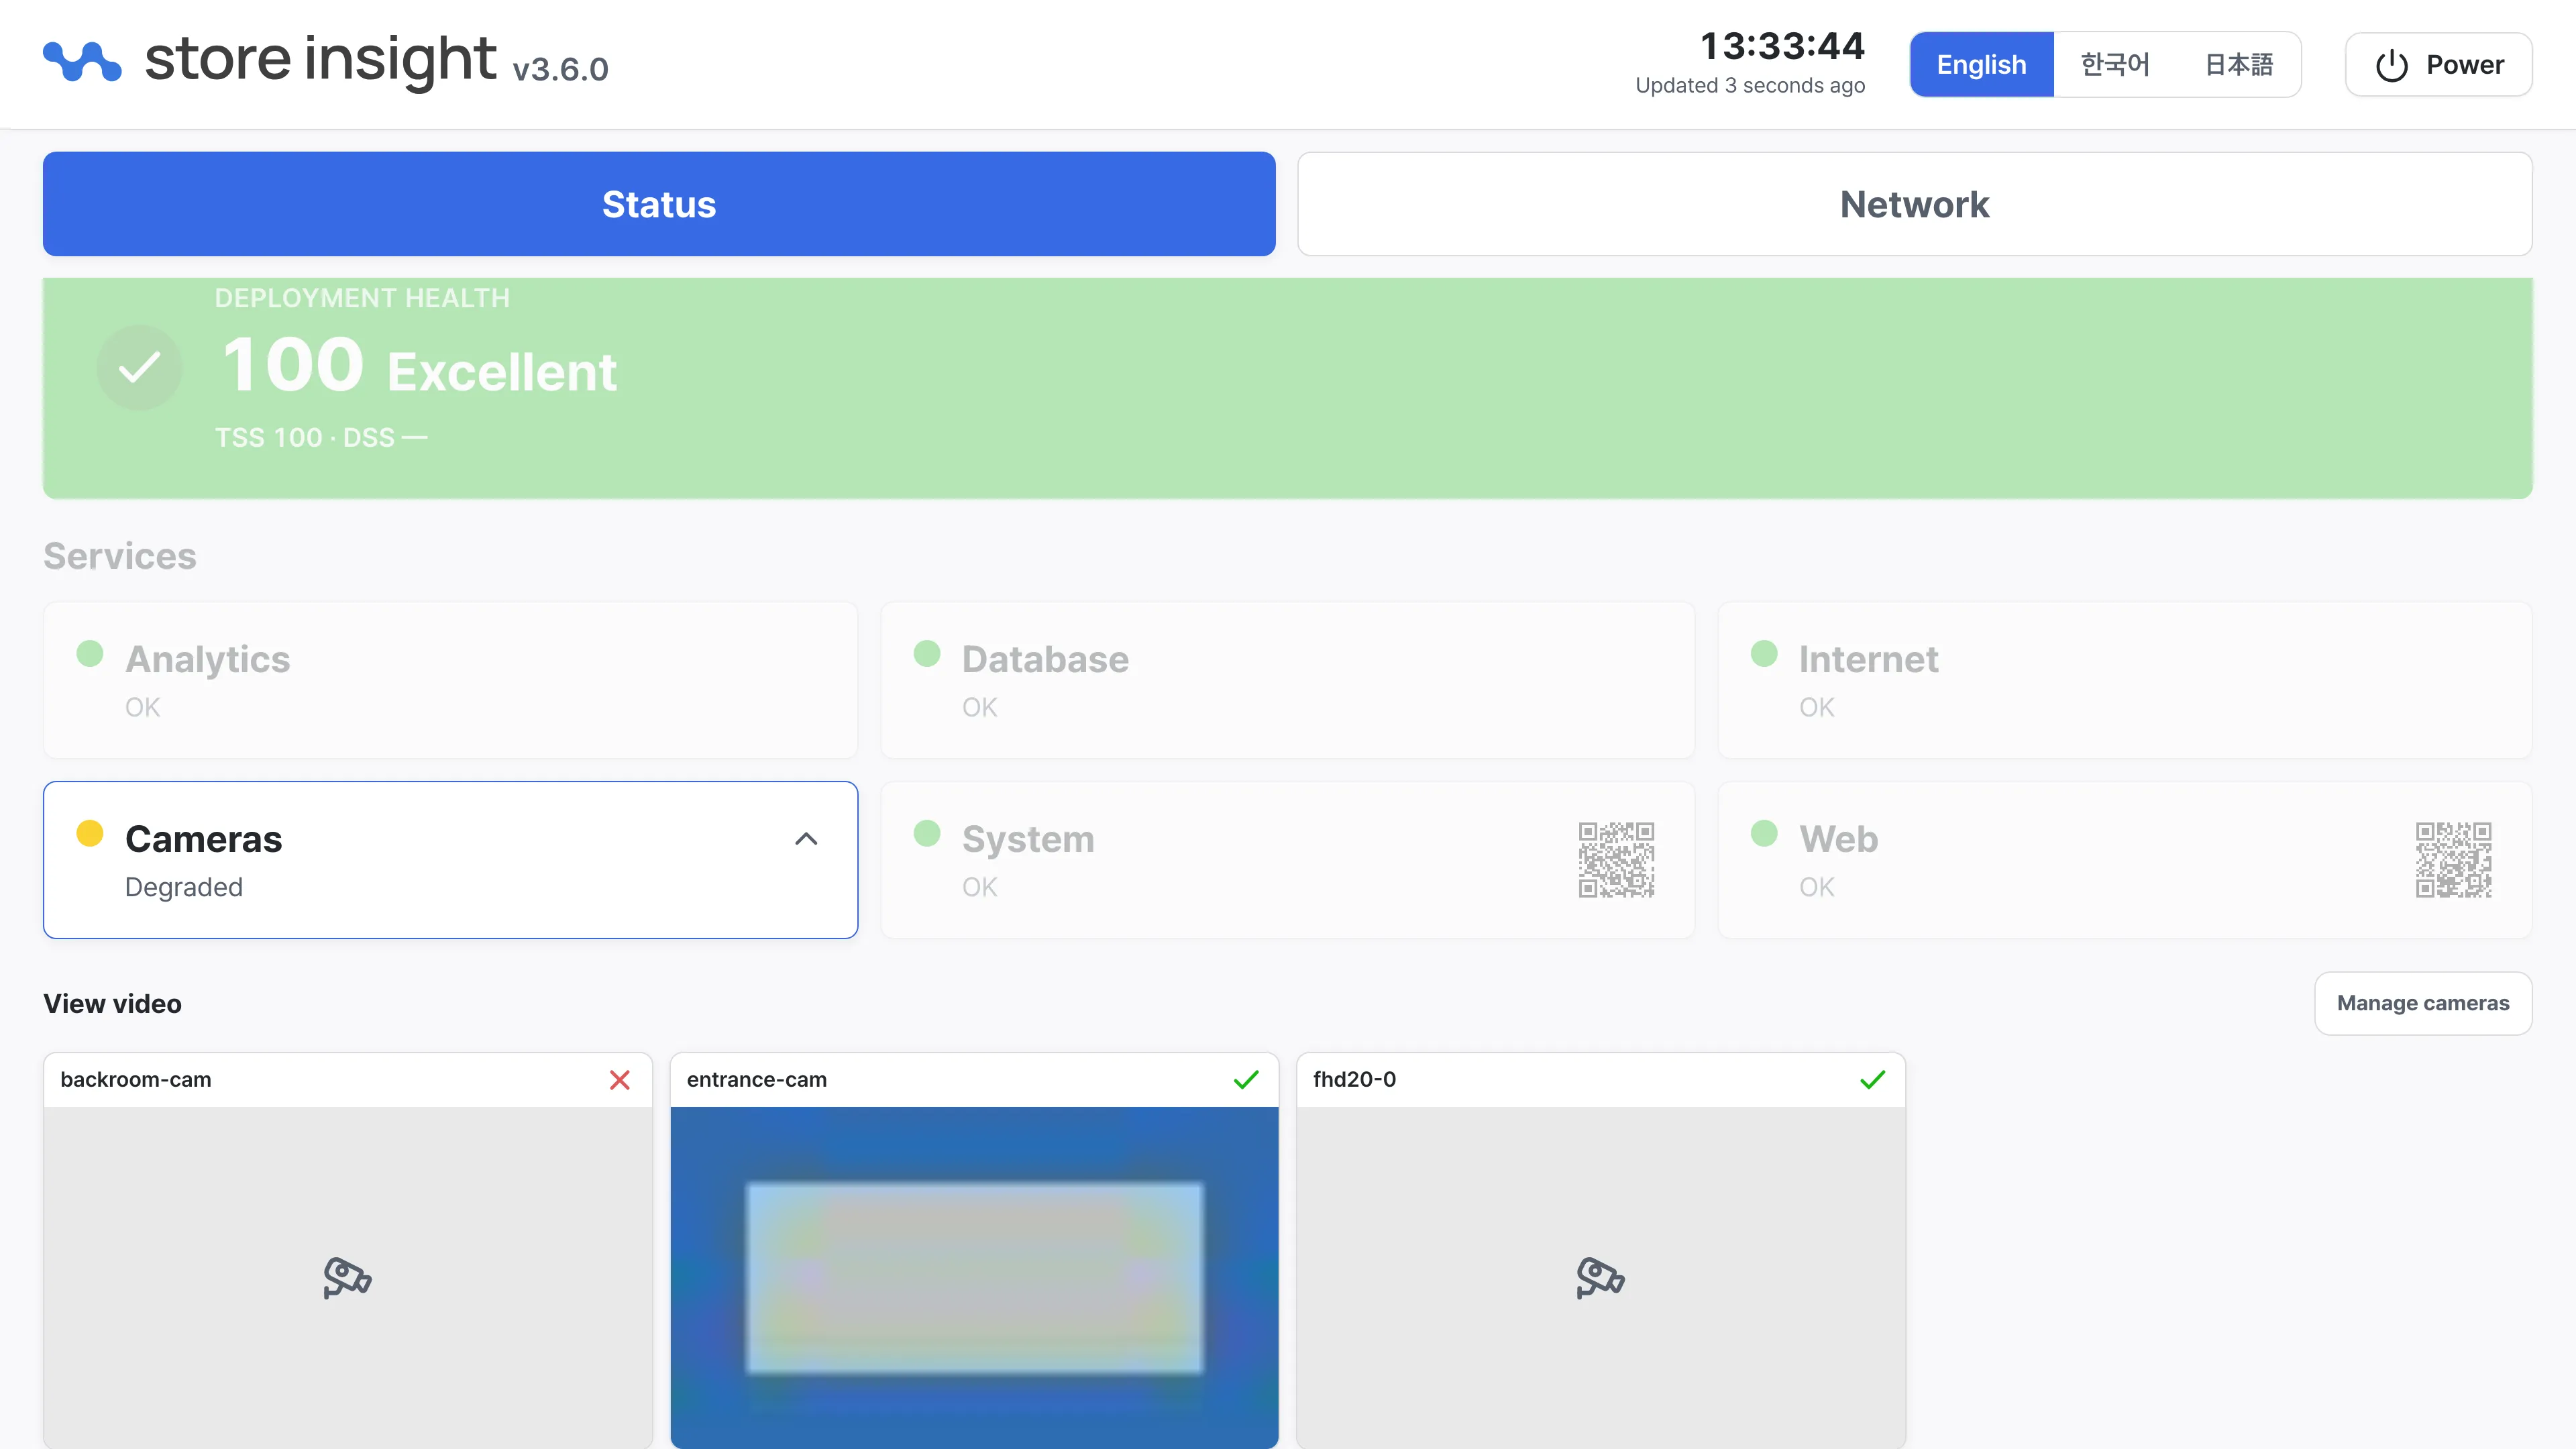
- Each tile shows the camera name with Reachable (green check) or Unreachable (red mark).
- If a picture was stored when the camera was registered, it appears on the tile, so you can match what is on screen against the camera on the wall.
- The Manage cameras button at the top right finds and registers new cameras — see Camera management.
Right after registering new cameras, the Cameras card can briefly turn red while the video services restart. A notice — “Registering cameras restarted the video pipeline; streams are coming back” — appears alongside and clears itself once the streams return.
System resources · Storage · GPU
The bottom of the screen shows the device’s hardware state.
- System resources — CPU and memory usage gauges.
- Storage — Usage and capacity per storage volume.
- GPU — Temperature, memory, and utilization for each graphics device used for video analysis. The temperature turns a warning color when it runs hot.
Temporarily high usage is normal, but if storage usage stays high continuously or a GPU temperature stays in the warning color, see Overheating, and contact the Deeping Source technical team if it does not resolve.