

Visitor Info
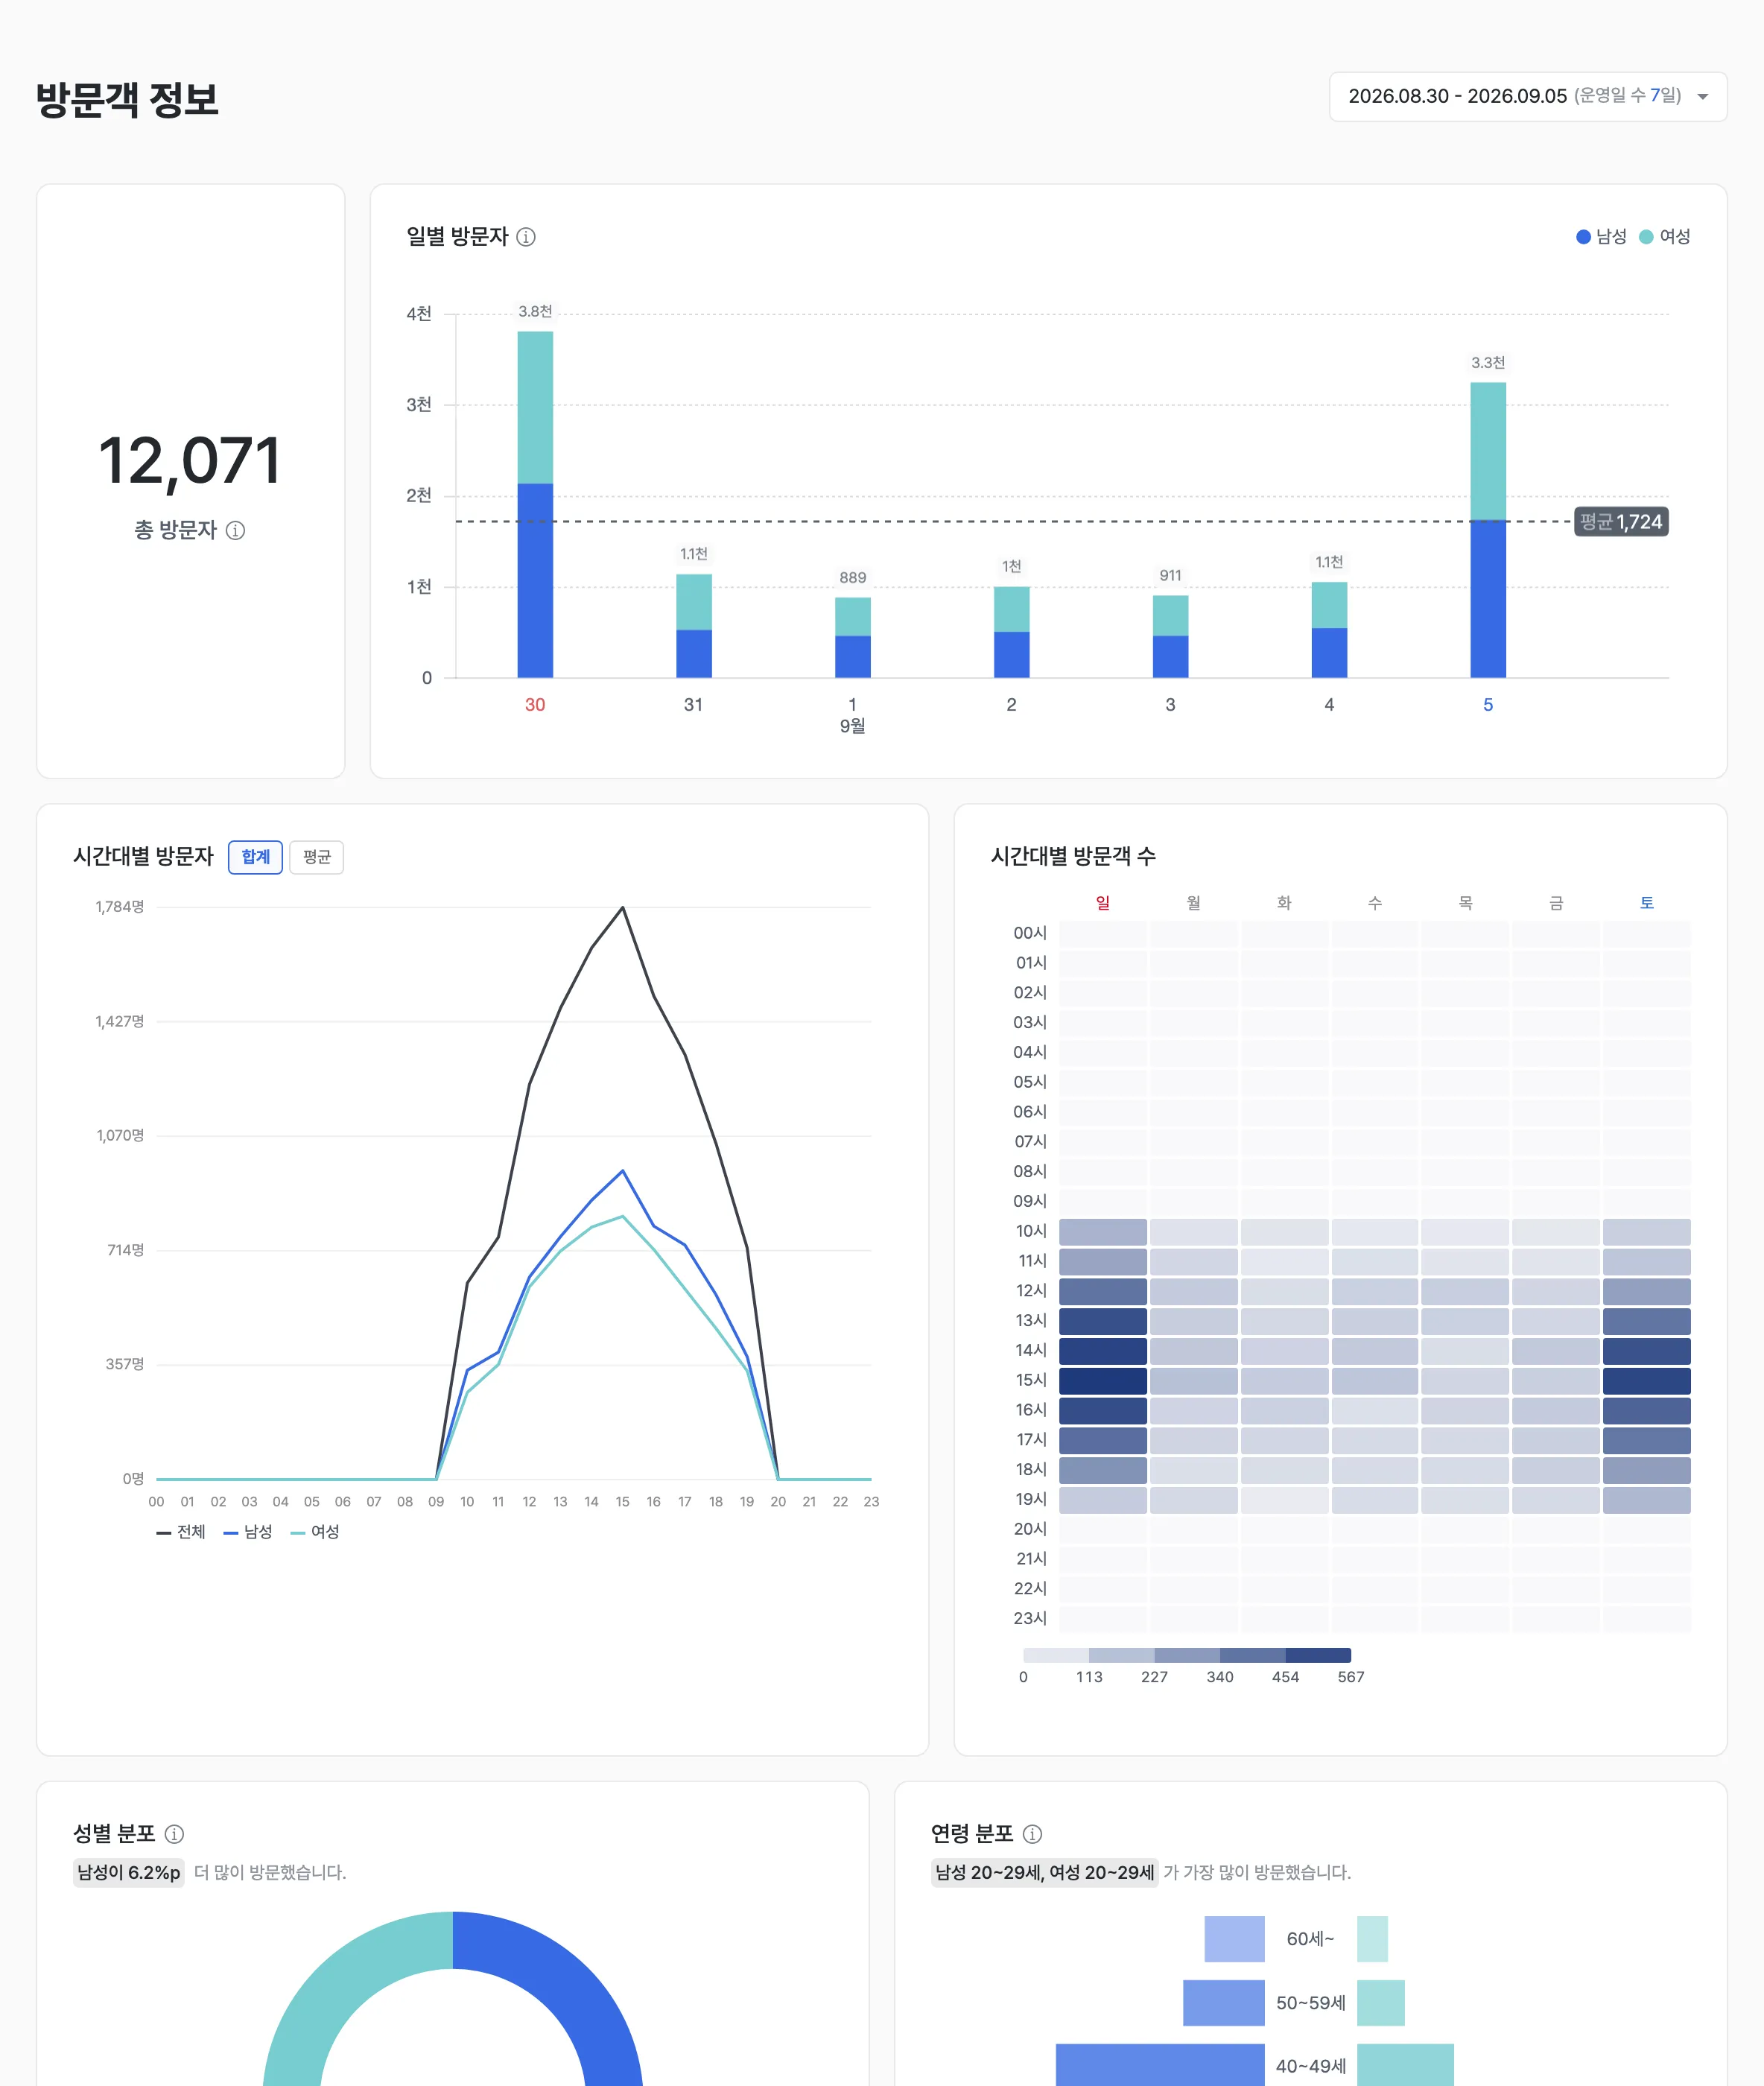
Visitor Info summarizes the size and makeup of the visitors to your store, together with the number of interested customers per displayed product. Store operators can check overall footfall, while customer (maker) representatives can see the store’s visitor profile along with the scale of interest in the products of the maker linked to their account.
Report screen / layout
Total visitors · Daily visitors
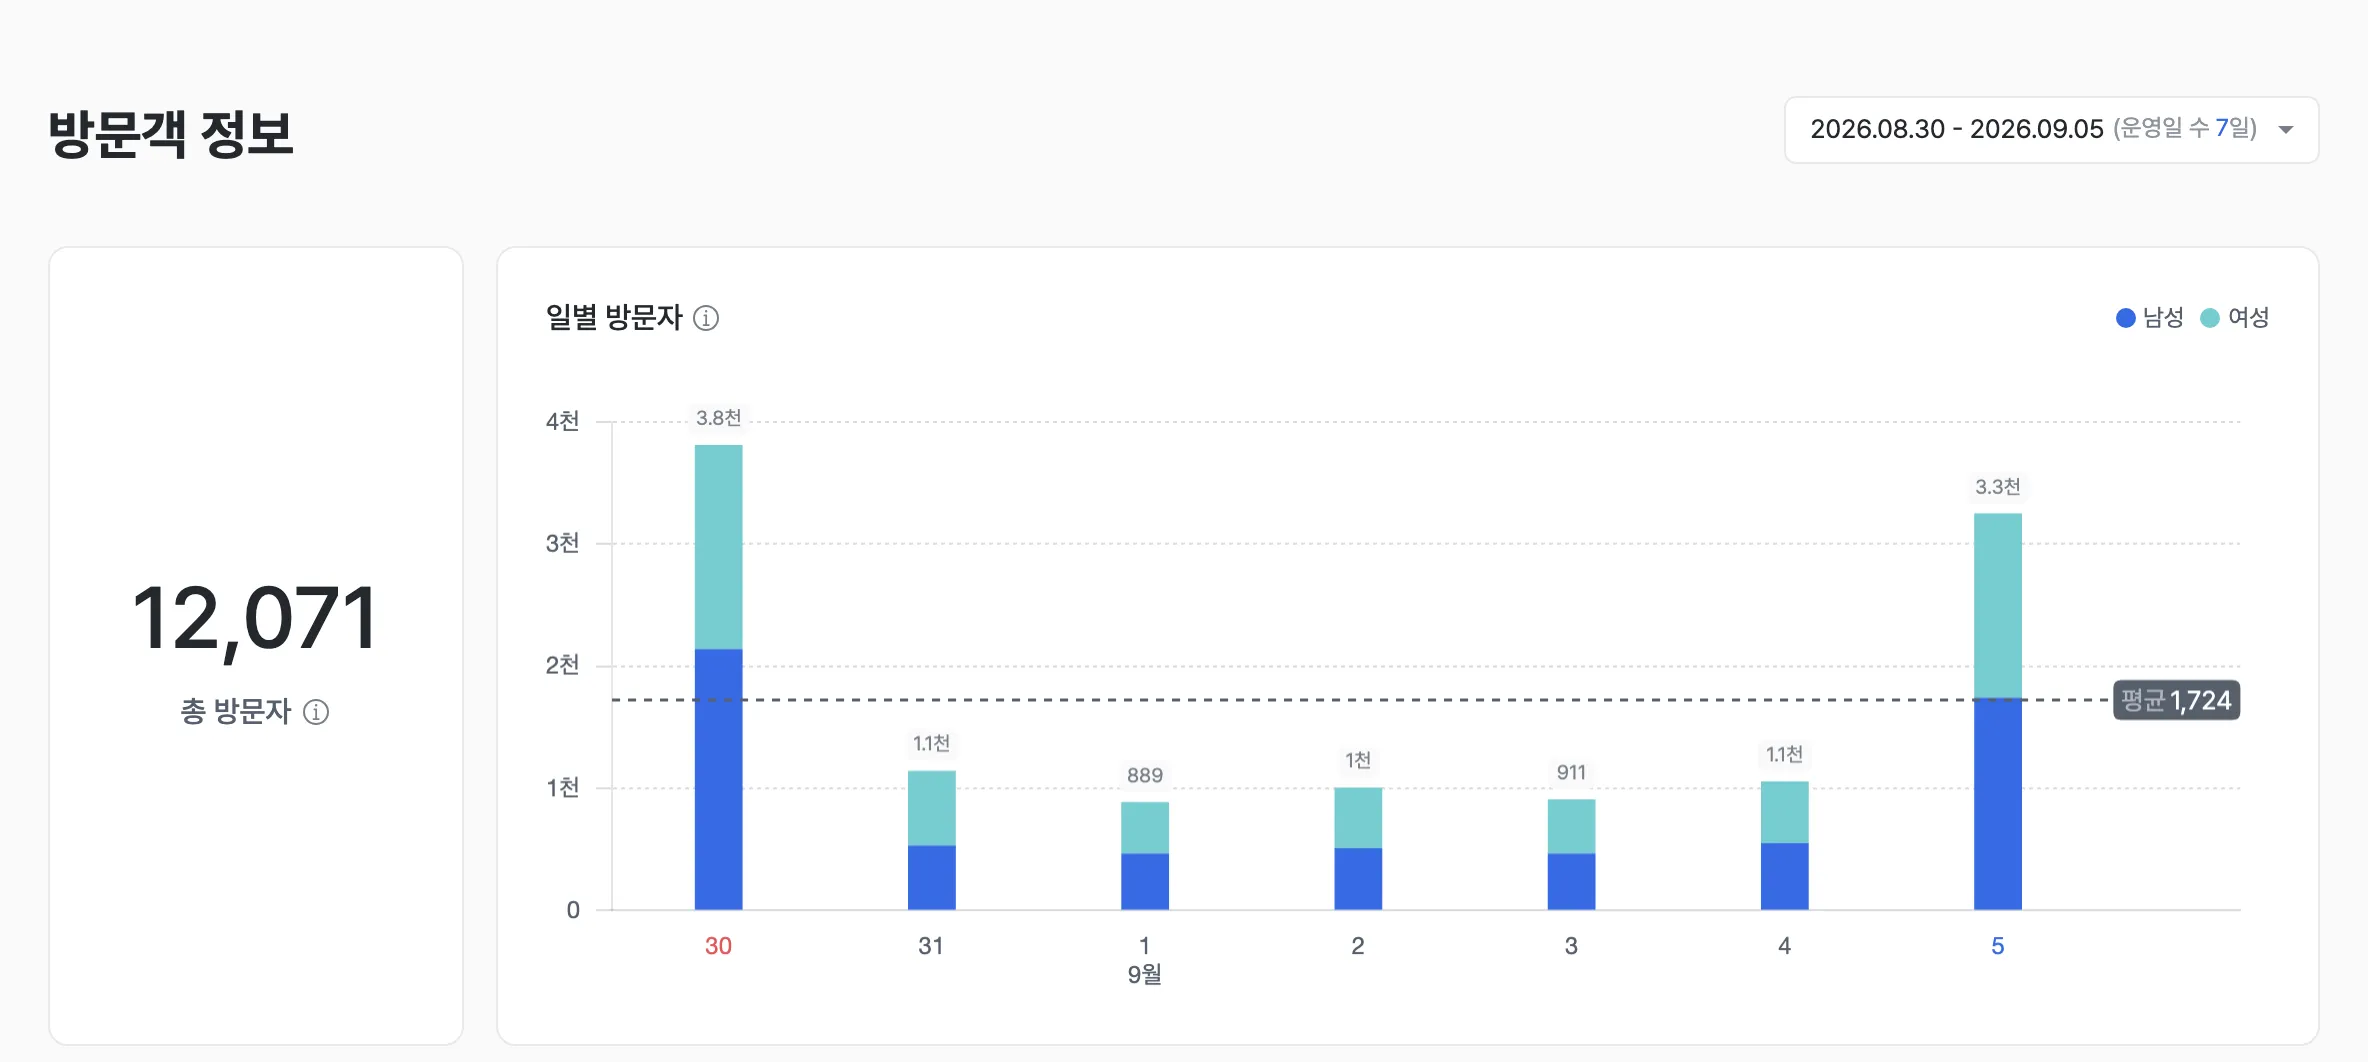
- Total visitors is the total number of entrance passes during the selected period. If the same person passes several times, each pass is counted.
- Daily visitors shows the number of visitors per day as a bar chart split by male and female, with a dotted line for the period average.
Examples
- Compare weekend and weekday footfall to plan promotions and staffing schedules.
- Use it as a baseline to share the store’s footfall with customer (maker) representatives.
Hourly visitors
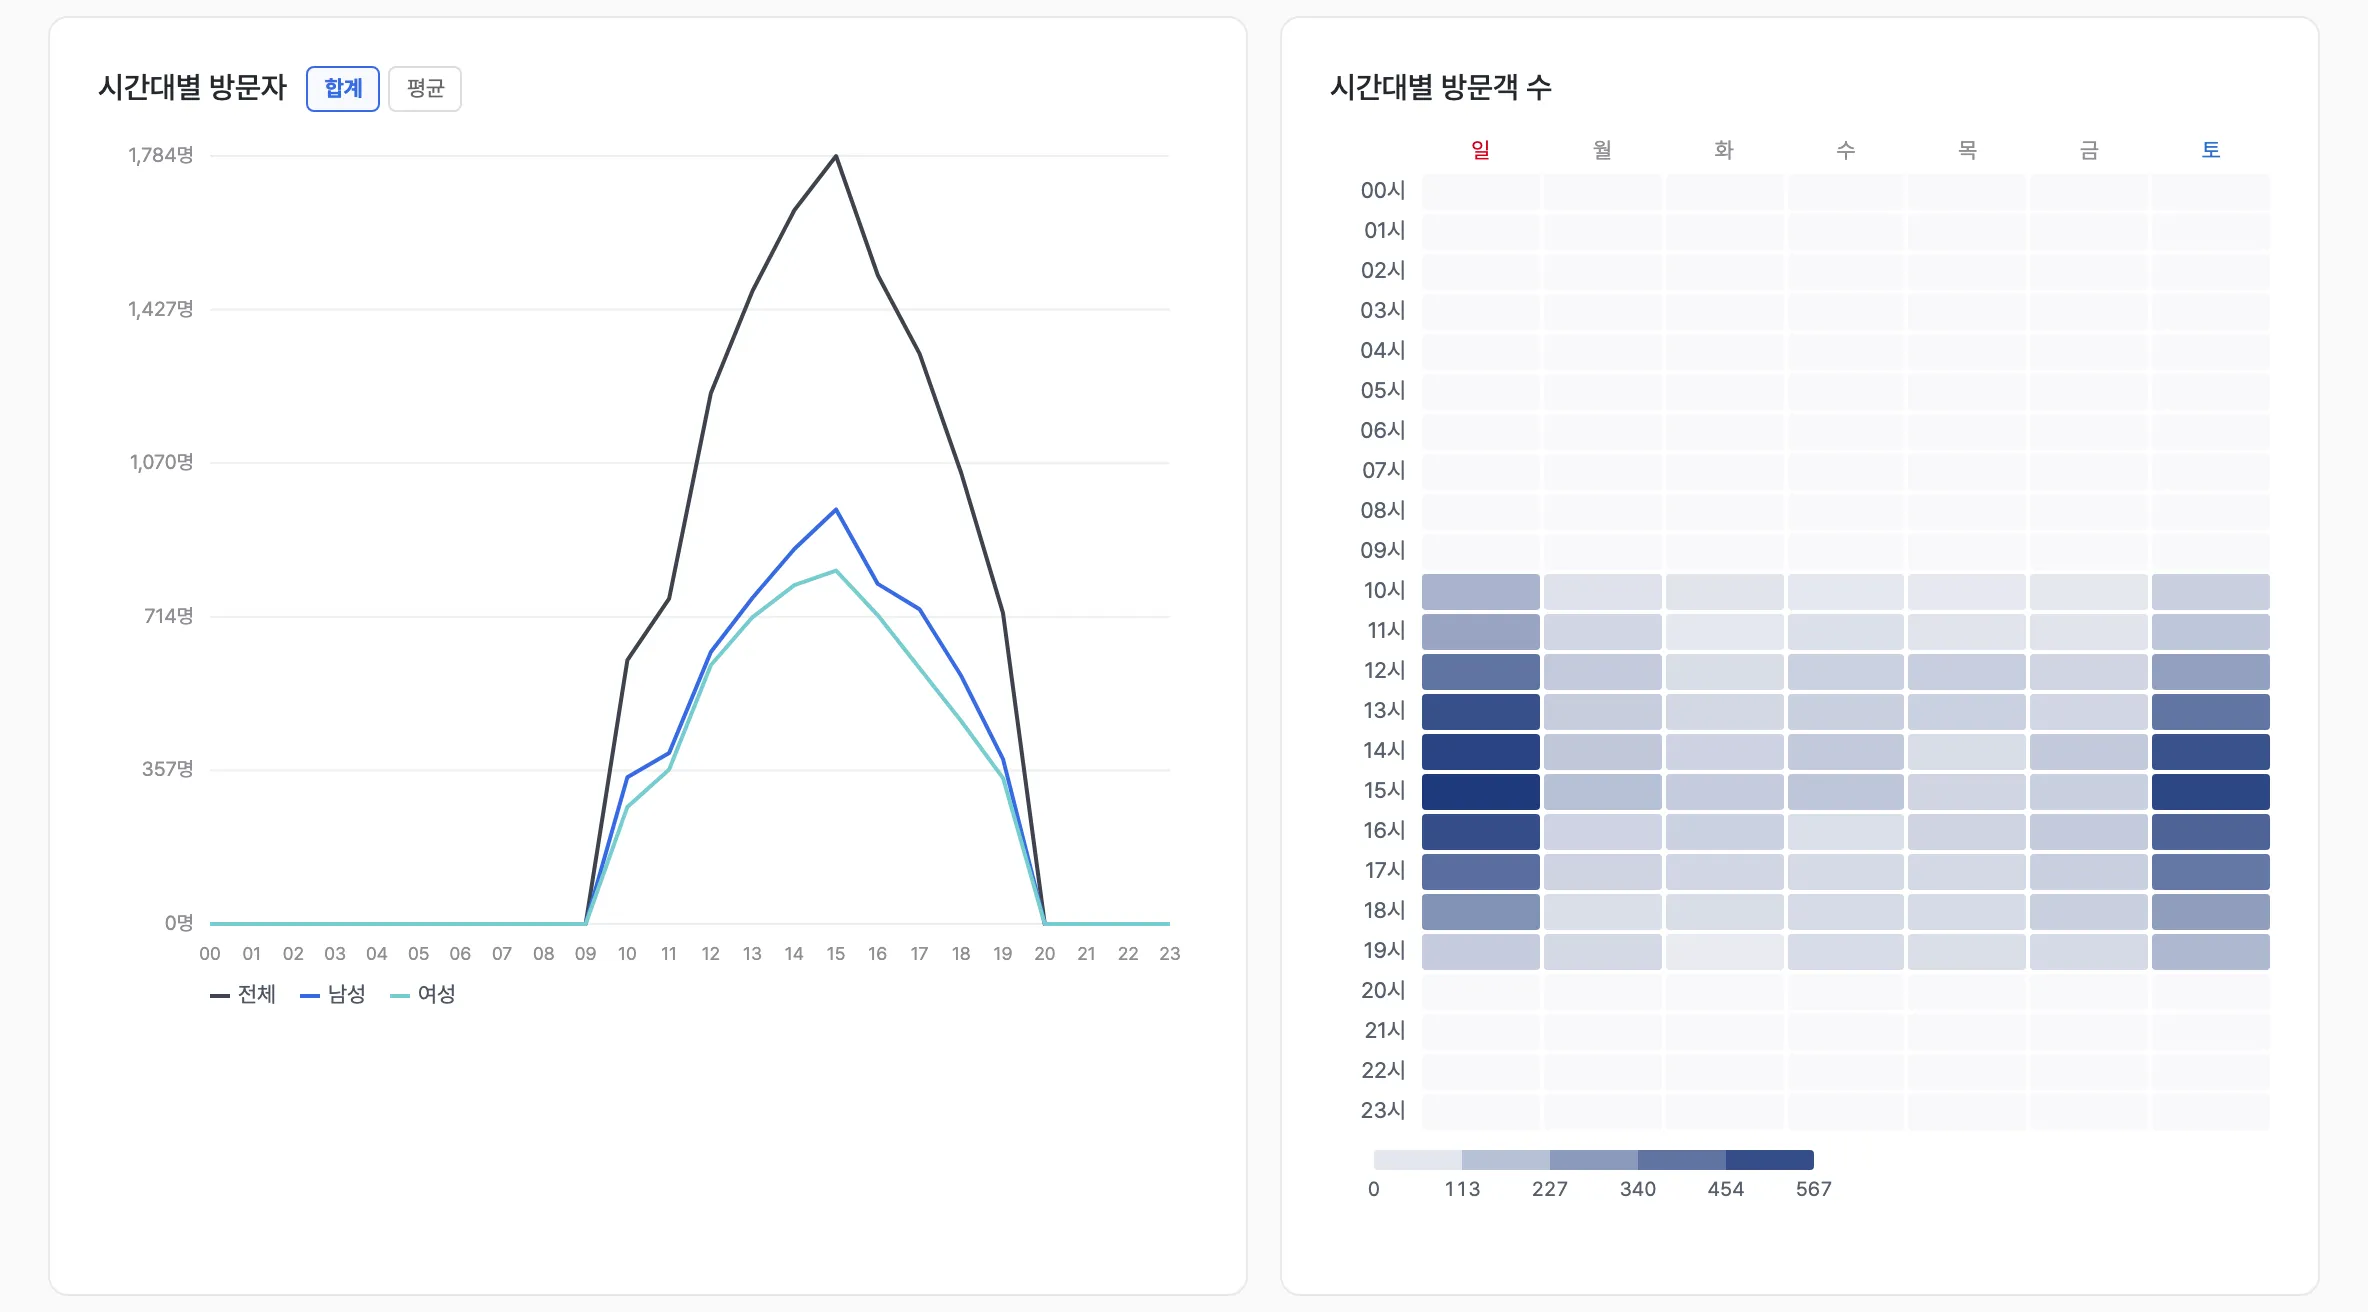
- Hourly visitors shows the visitor count from 00 to 23 as line graphs for all, male, and female visitors. Use the Total / Average buttons to switch between the period total and the daily average.
- Visitor count by hour is a table crossing days of the week (Sun–Sat) with hours; the darker the cell, the more visitors in that time slot.
Examples
- Assign product demo and explanation staff to the days and hours when visitors concentrate.
- Identify quiet hours to schedule display changes and checks.
Gender · Age distribution
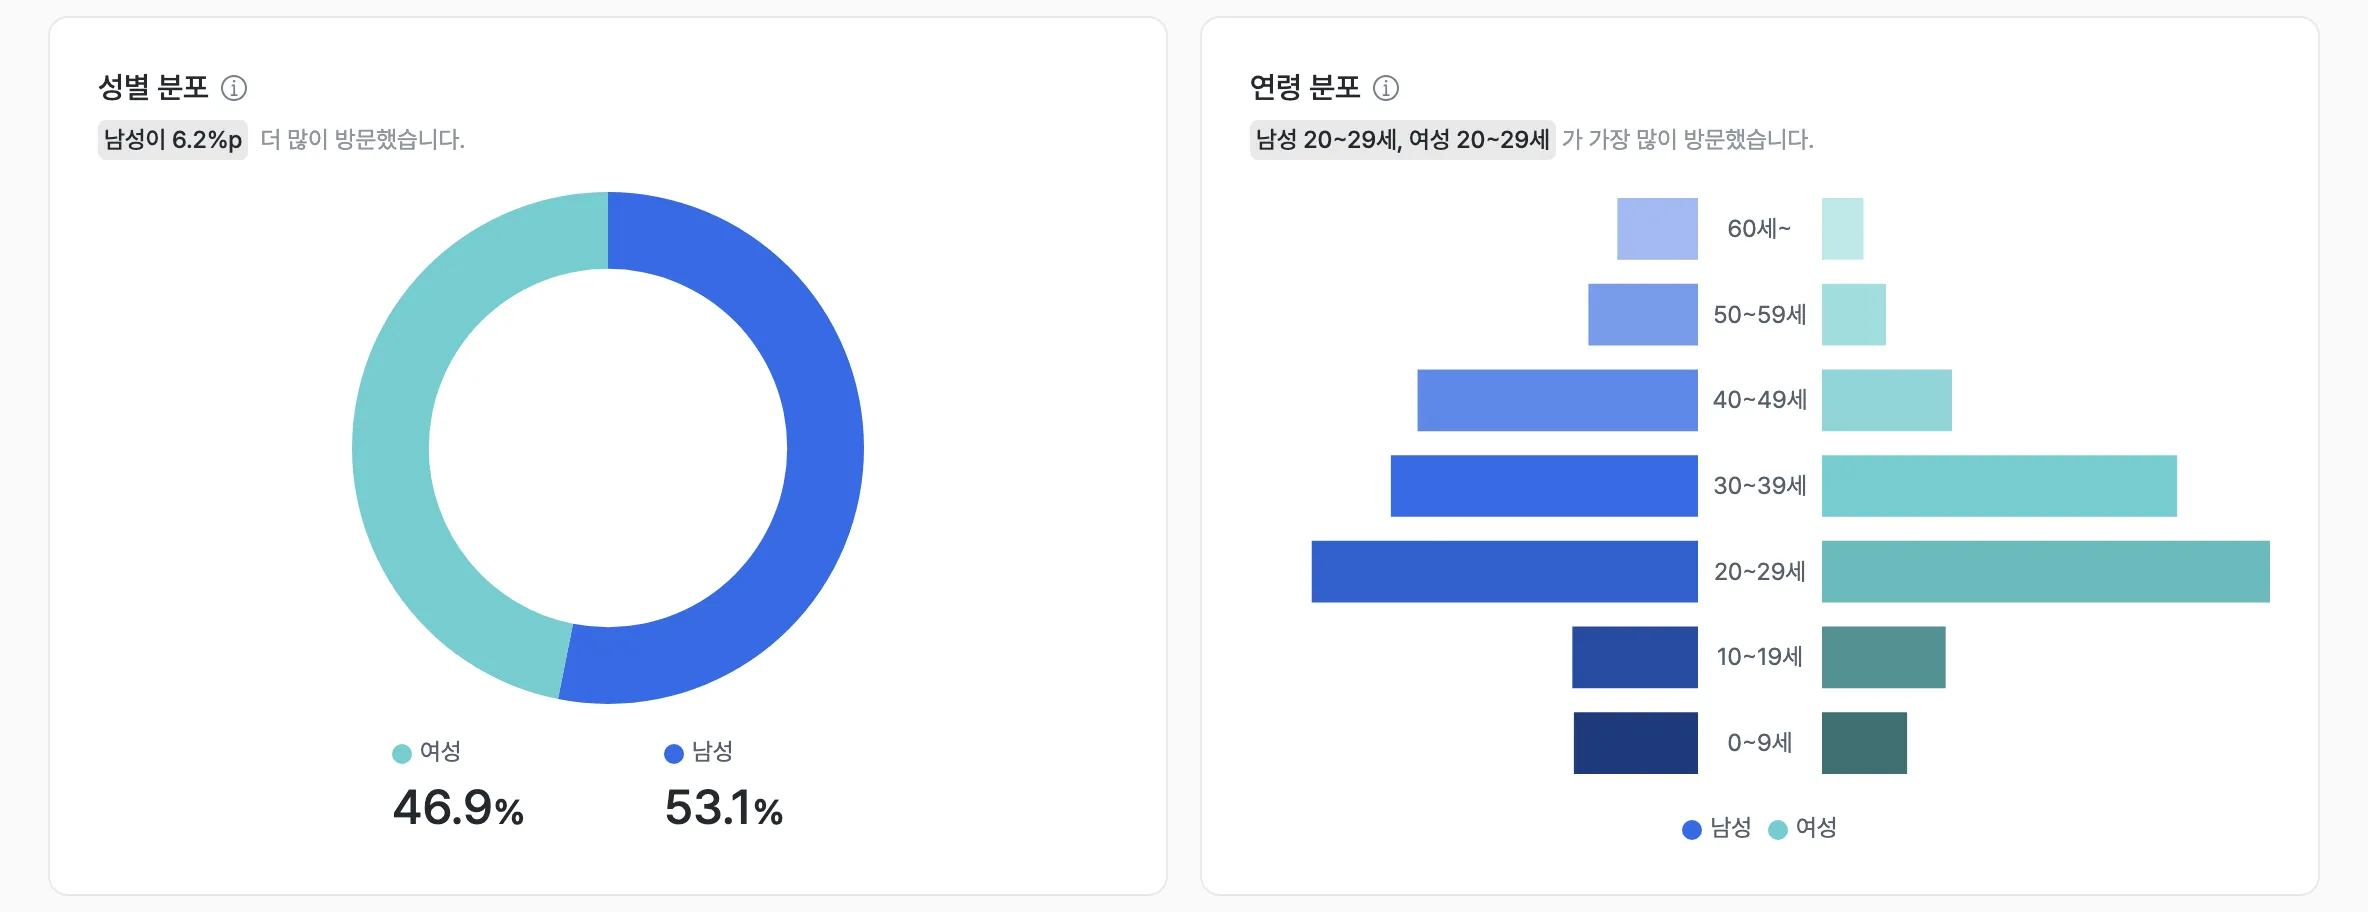
- Gender distribution is the male-to-female ratio (%) of total visitors.
- Age distribution shows the age makeup of total visitors, split by gender. The summary sentence names the age group with the largest share for each gender. (If shares are equal, the younger age group is shown.)
Examples
- Identify the store’s core visitor segment to review the product lineup and targeting.
- Check whether a product’s target customers match the store’s actual visitors.
Interested customers per product
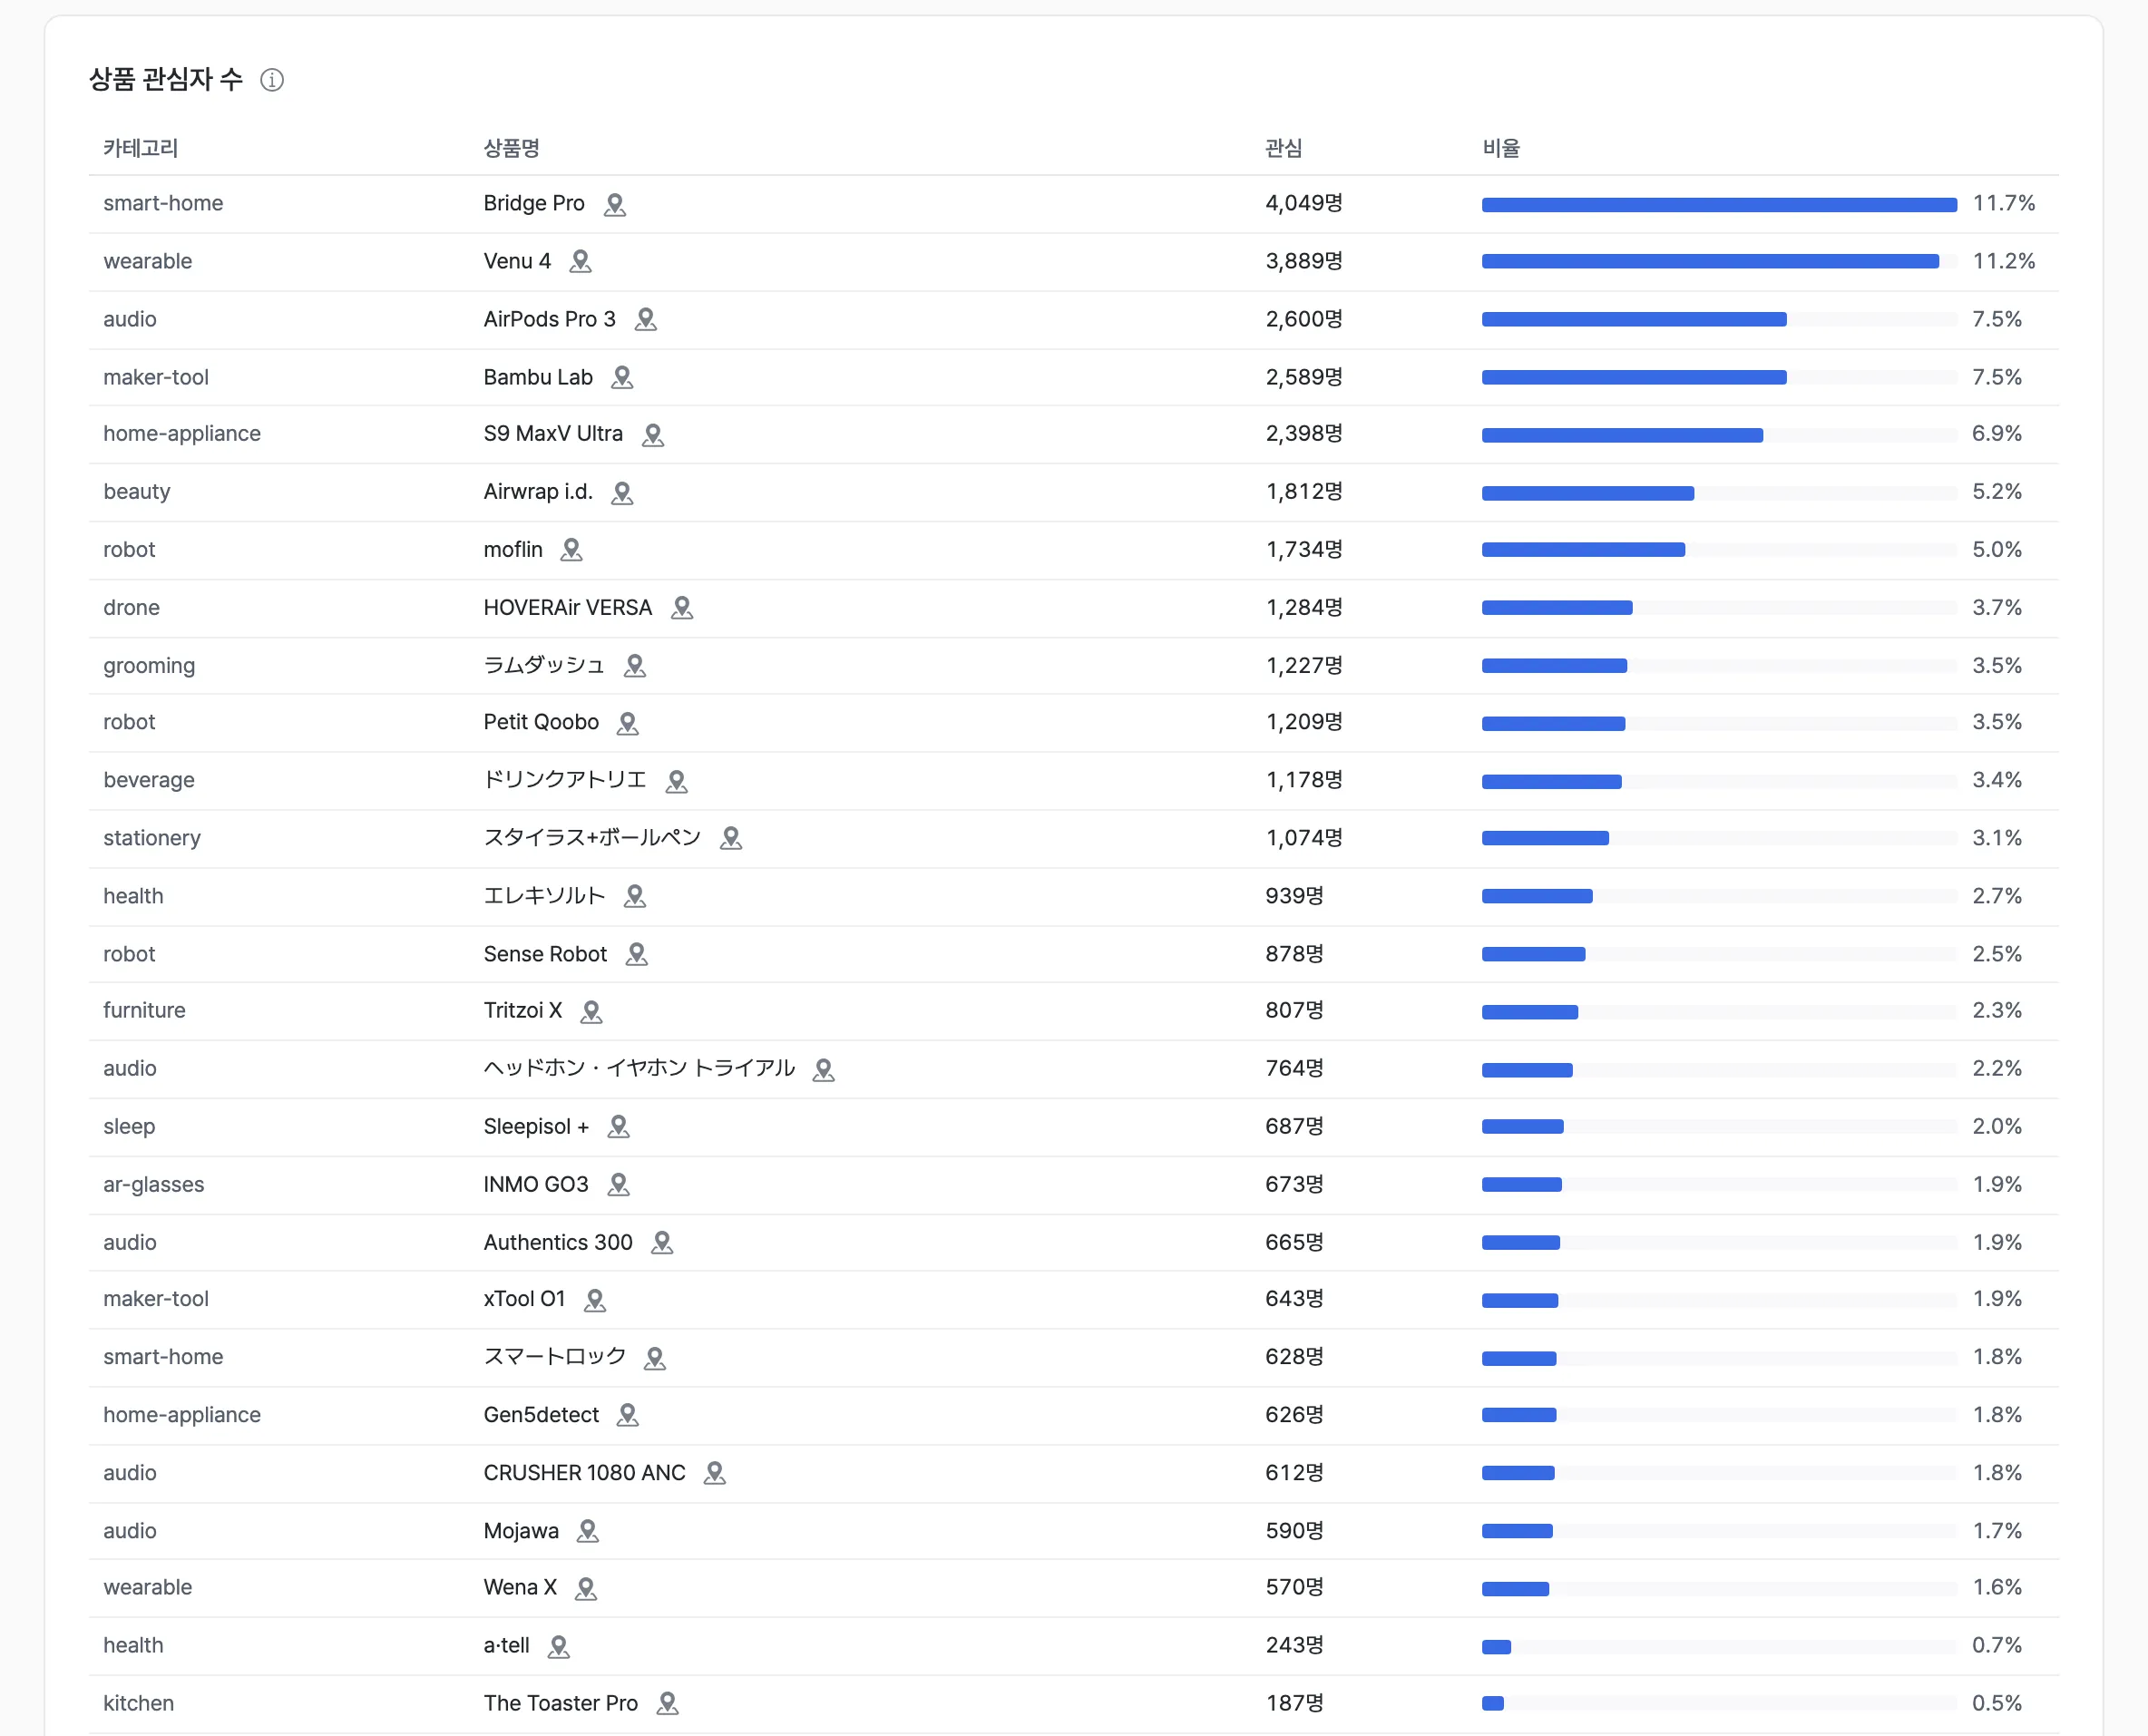
- Shows the number of interested customers and the share for each displayed product, sorted by the number of interested customers.
- Interest is the number of customers who entered the zone in front of the display stand (the interest zone), stood in front of the display stand, and looked at it for at least the exploration threshold time set in the funnel analysis settings.
- Share is calculated as
interest ÷ total interest across all display stands × 100.
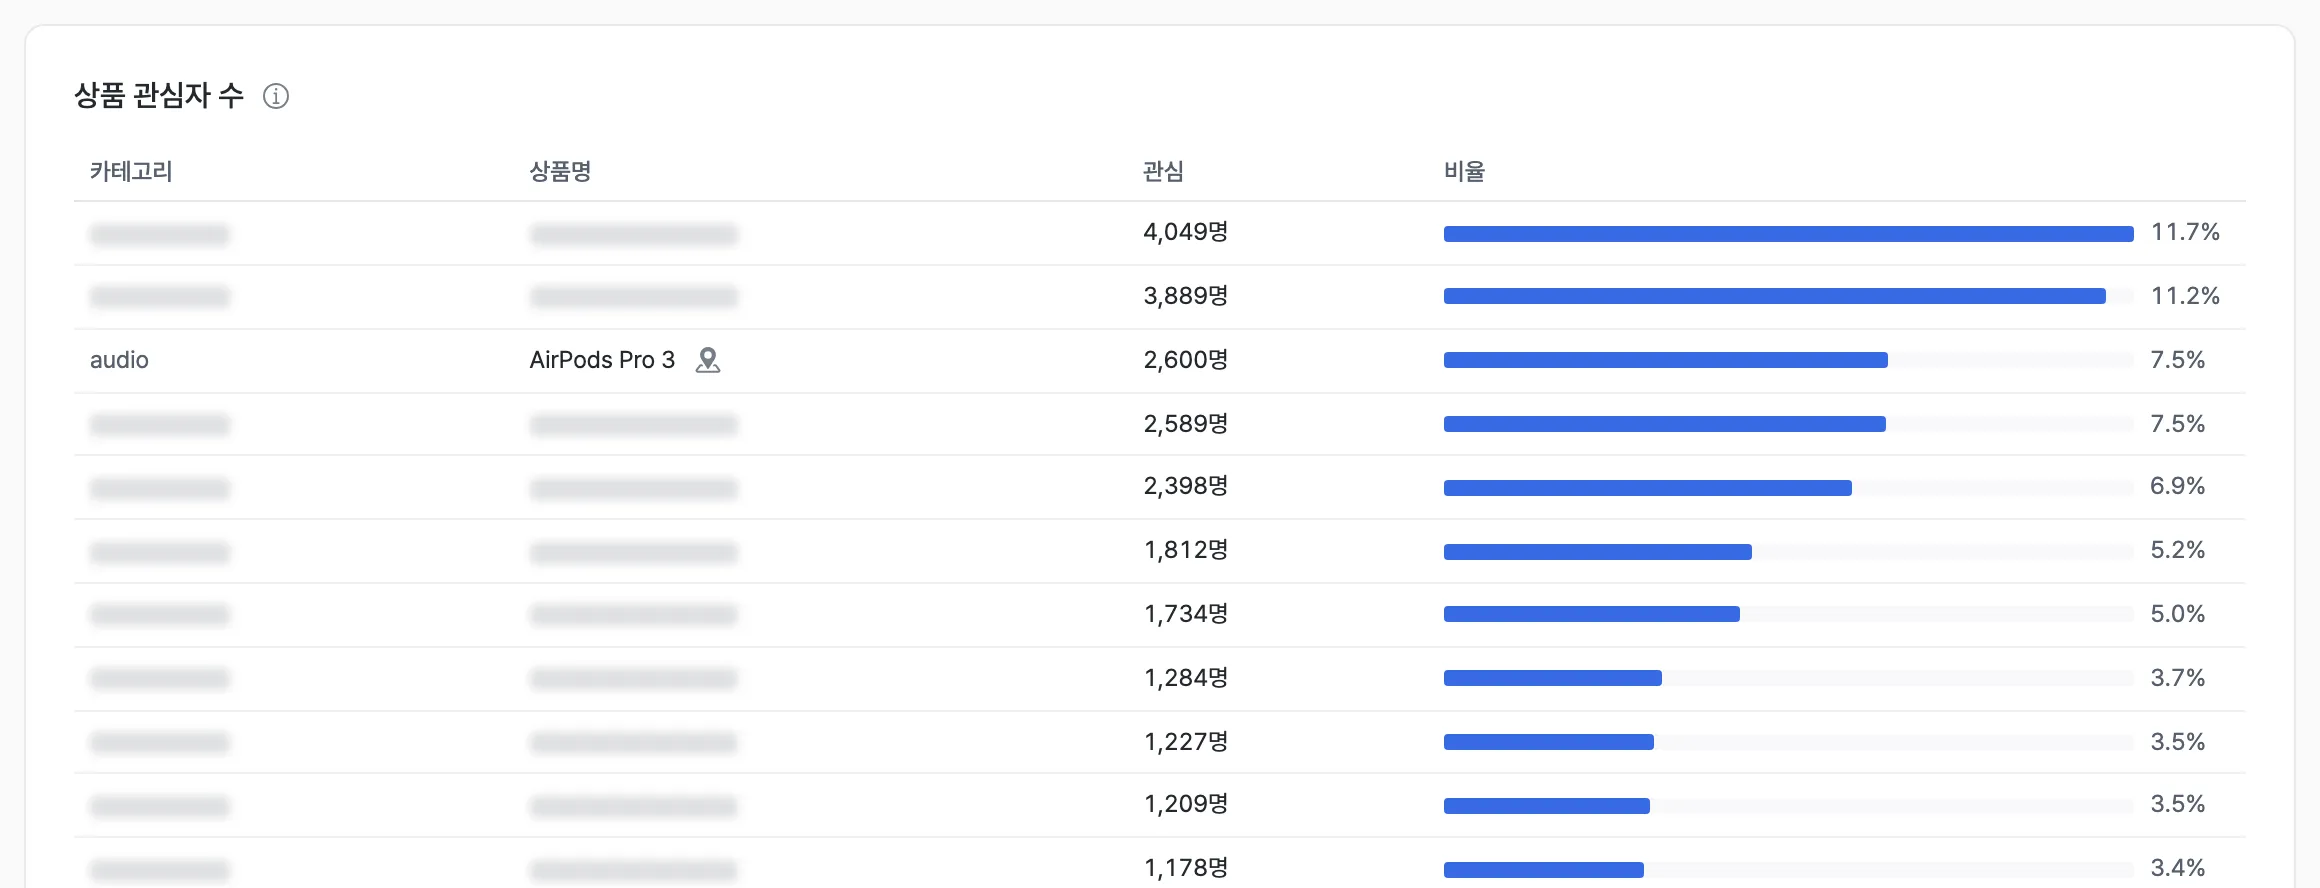
- When a customer account is issued, only the products of the maker linked to the account are shown. For all other products, the category and product name are blurred. The number of interested customers and the share are still shown, so you can compare where the linked maker’s products rank among all products in the store.
Examples
- Quickly tell apart the products that attract interest from those that don’t.
- Review the display position and presentation of products with a low interest share.
- For a detailed comparison, check the interest rate relative to visits in the Product Interest report.
Key metrics (KPIs)
| Metric | Description | Insight |
|---|---|---|
| Total visitors | Total number of entrance passes in the selected period (duplicates included) | Gauge the store’s footfall |
| Daily · hourly visitors | Visitor count by date and by hour | Identify peak times and plan operating schedules |
| Gender / age distribution | Share of visitors by gender and age group | Identify the core visitor segment and check target fit |
| Interested customers per product | Customers who looked at the product for at least the exploration threshold time | Compare the scale of interest across products |
| Interest share | The product’s share of total interest across all products | Understand relative attention among products in the store |