

Product Interest
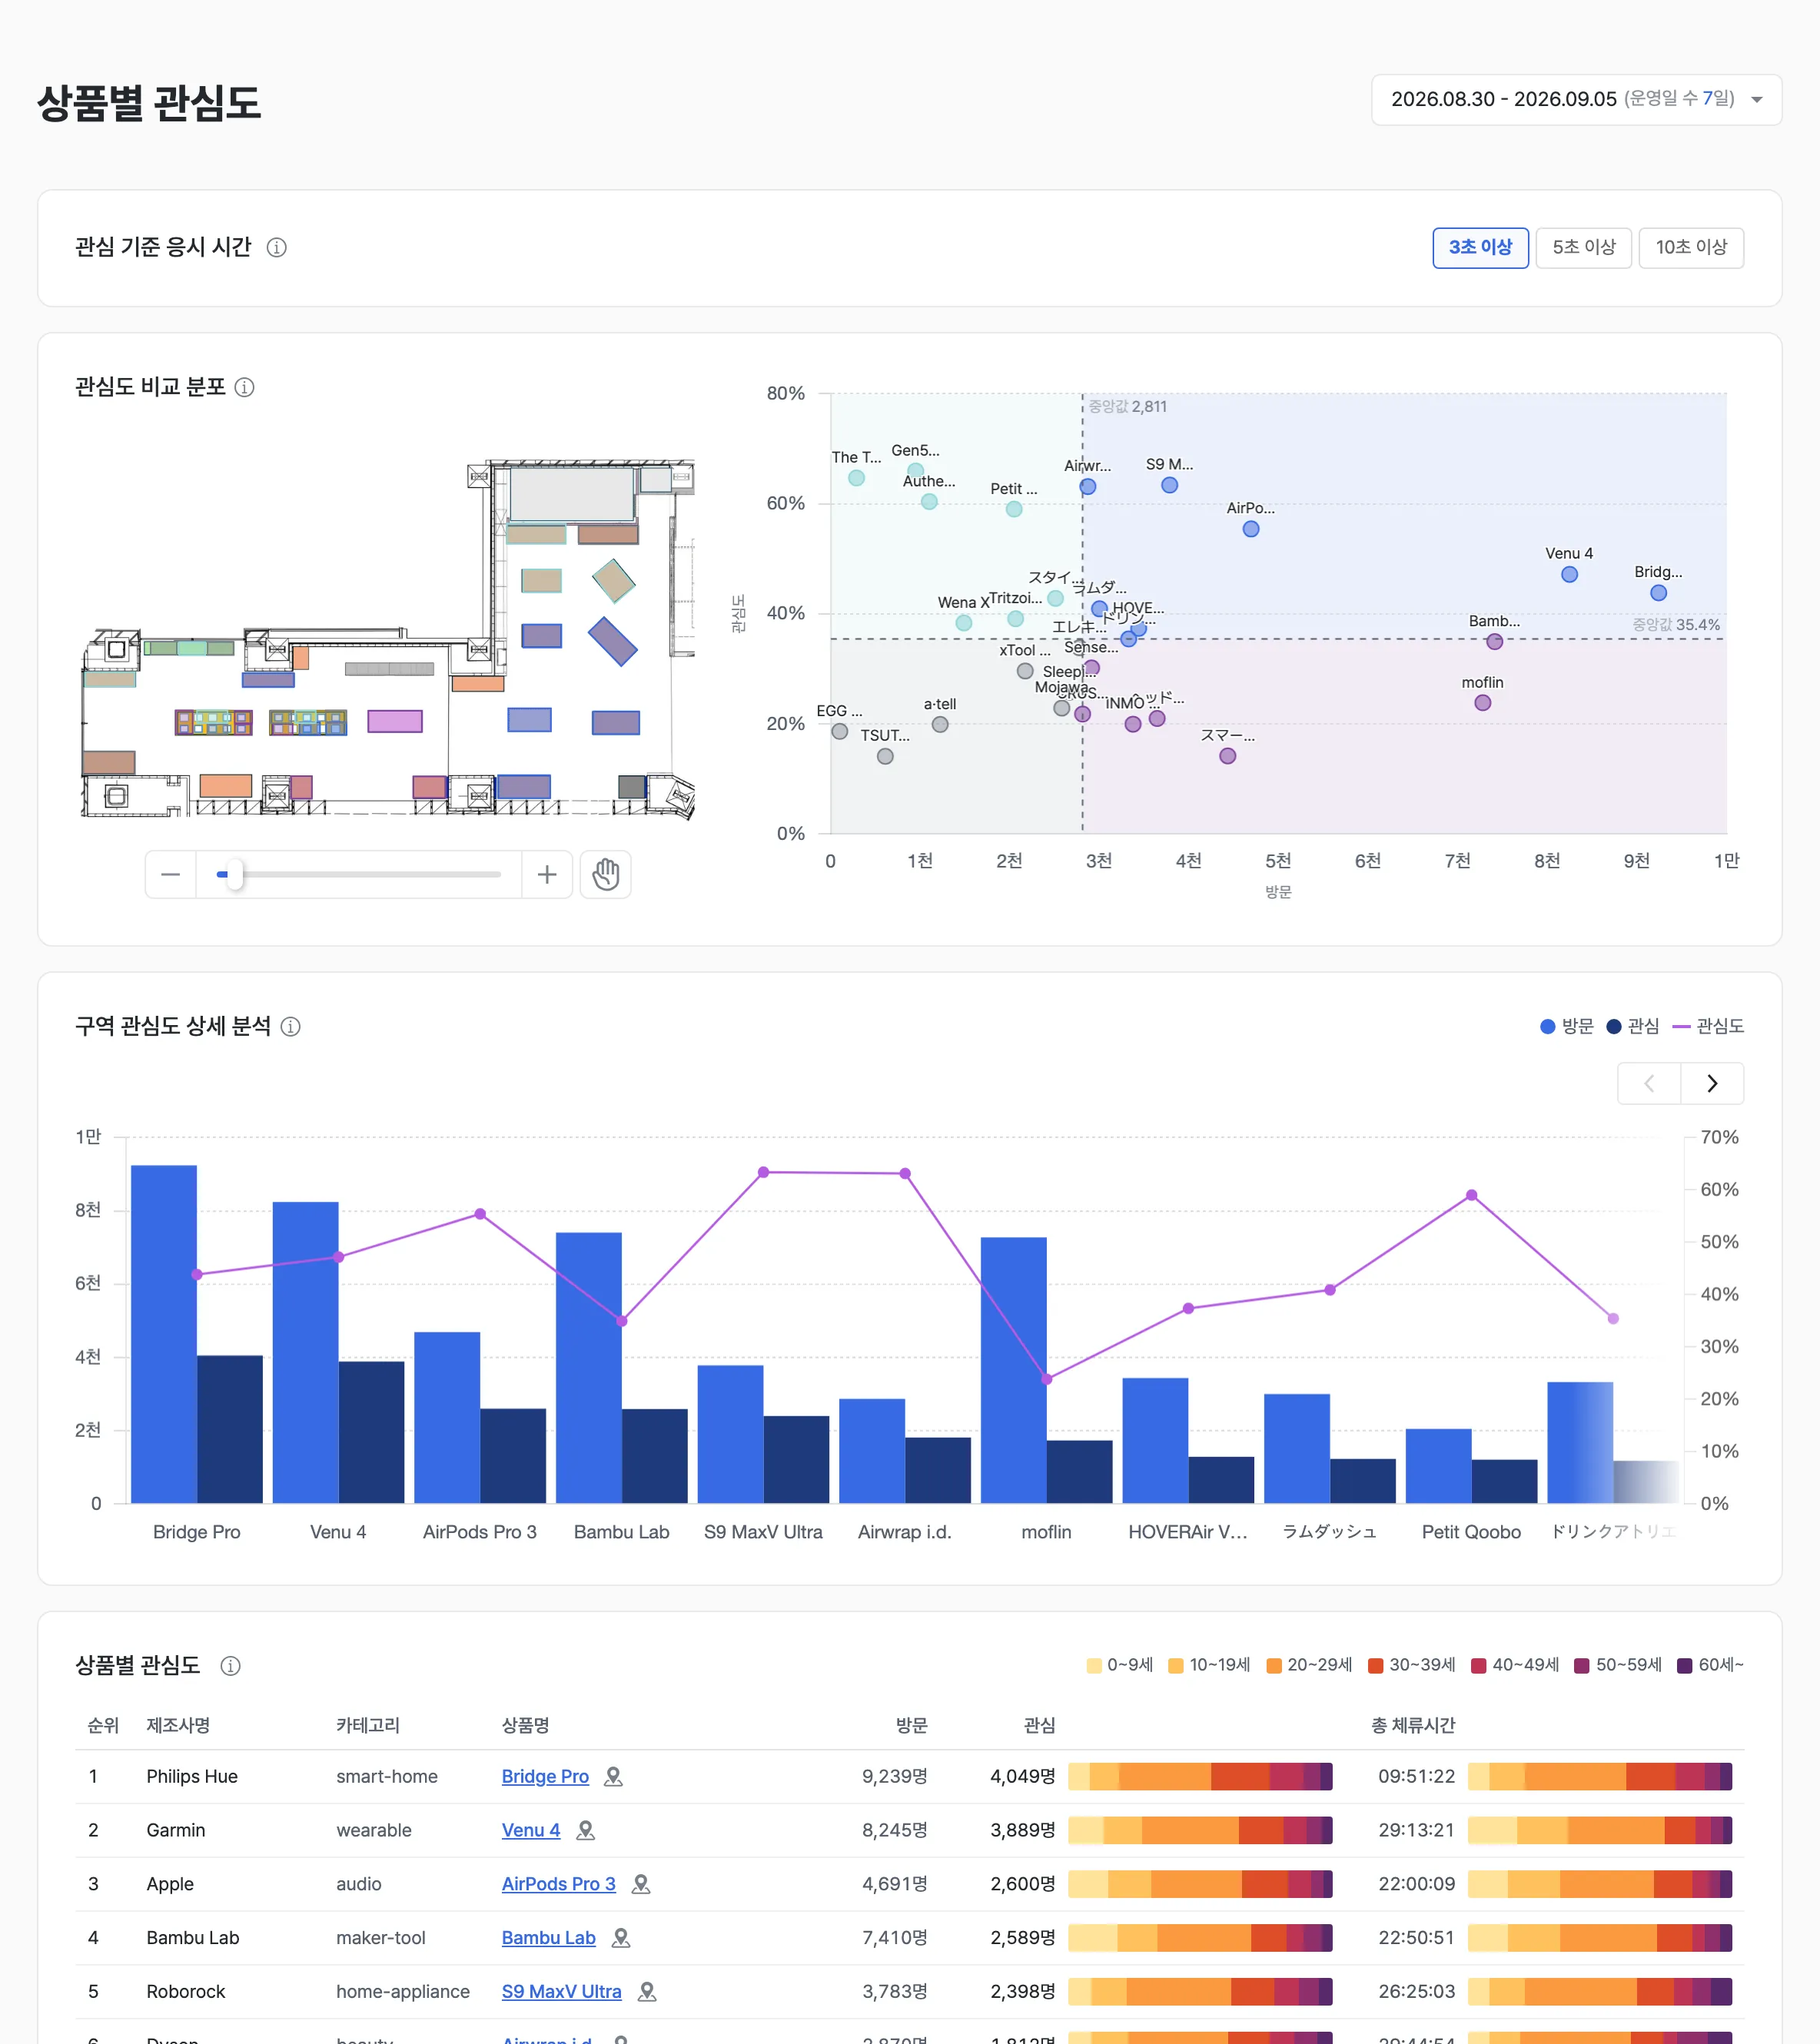
Product Interest quantifies customer response from visit → interest for every product displayed in the store. When a customer account is issued, only the products of the maker linked to the account are shown. All other products are blurred (hidden). See What a customer account sees below for details.
Metric definitions
| Metric | Definition |
|---|---|
| Visits | Customers who entered the zone in front of the display stand (the interest zone). A customer entering several times on the same day is counted once. |
| Interest | Visiting customers who stood in the zone in front of the display stand and looked at it for at least the selected time (3, 5, or 10 seconds) |
| Interest rate | interest ÷ visits × 100 |
| Total dwell time | The sum of the time interested customers spent from entering to leaving the zone in front of the display stand. A visit with no exit record counts as 0 seconds. |
| Average dwell time | total dwell time ÷ number of interested customers |
Report screen / layout
Interest gaze-time threshold

- Visiting customers who gazed at the display stand for at least this long are counted as interested.
- Choose 3 seconds or more / 5 seconds or more / 10 seconds or more; the selected threshold applies to every chart on this page at once.
Examples
- Compare product appeal in stages, separating a passing glance (3 seconds) from close examination (10 seconds).
- Evaluate products that need their description read with the 10-second threshold, and intuitive products with the 3-second threshold.
Interest comparison distribution
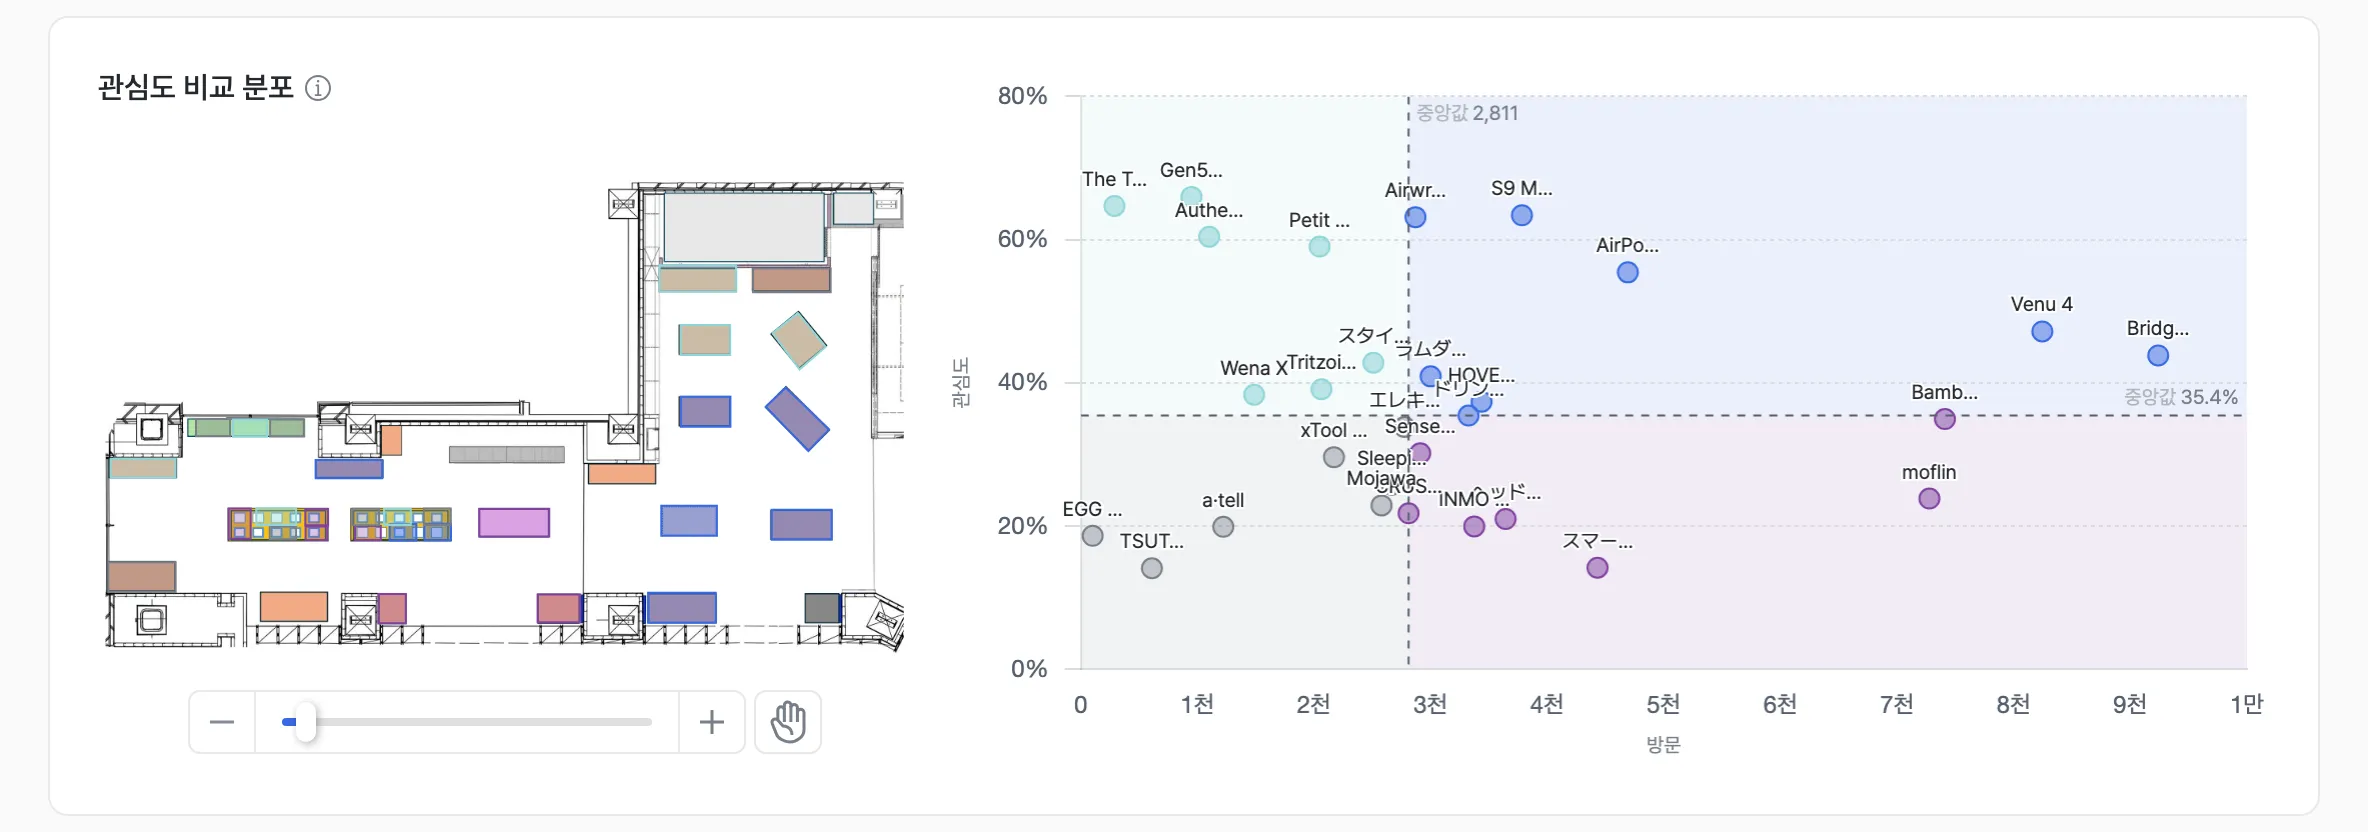
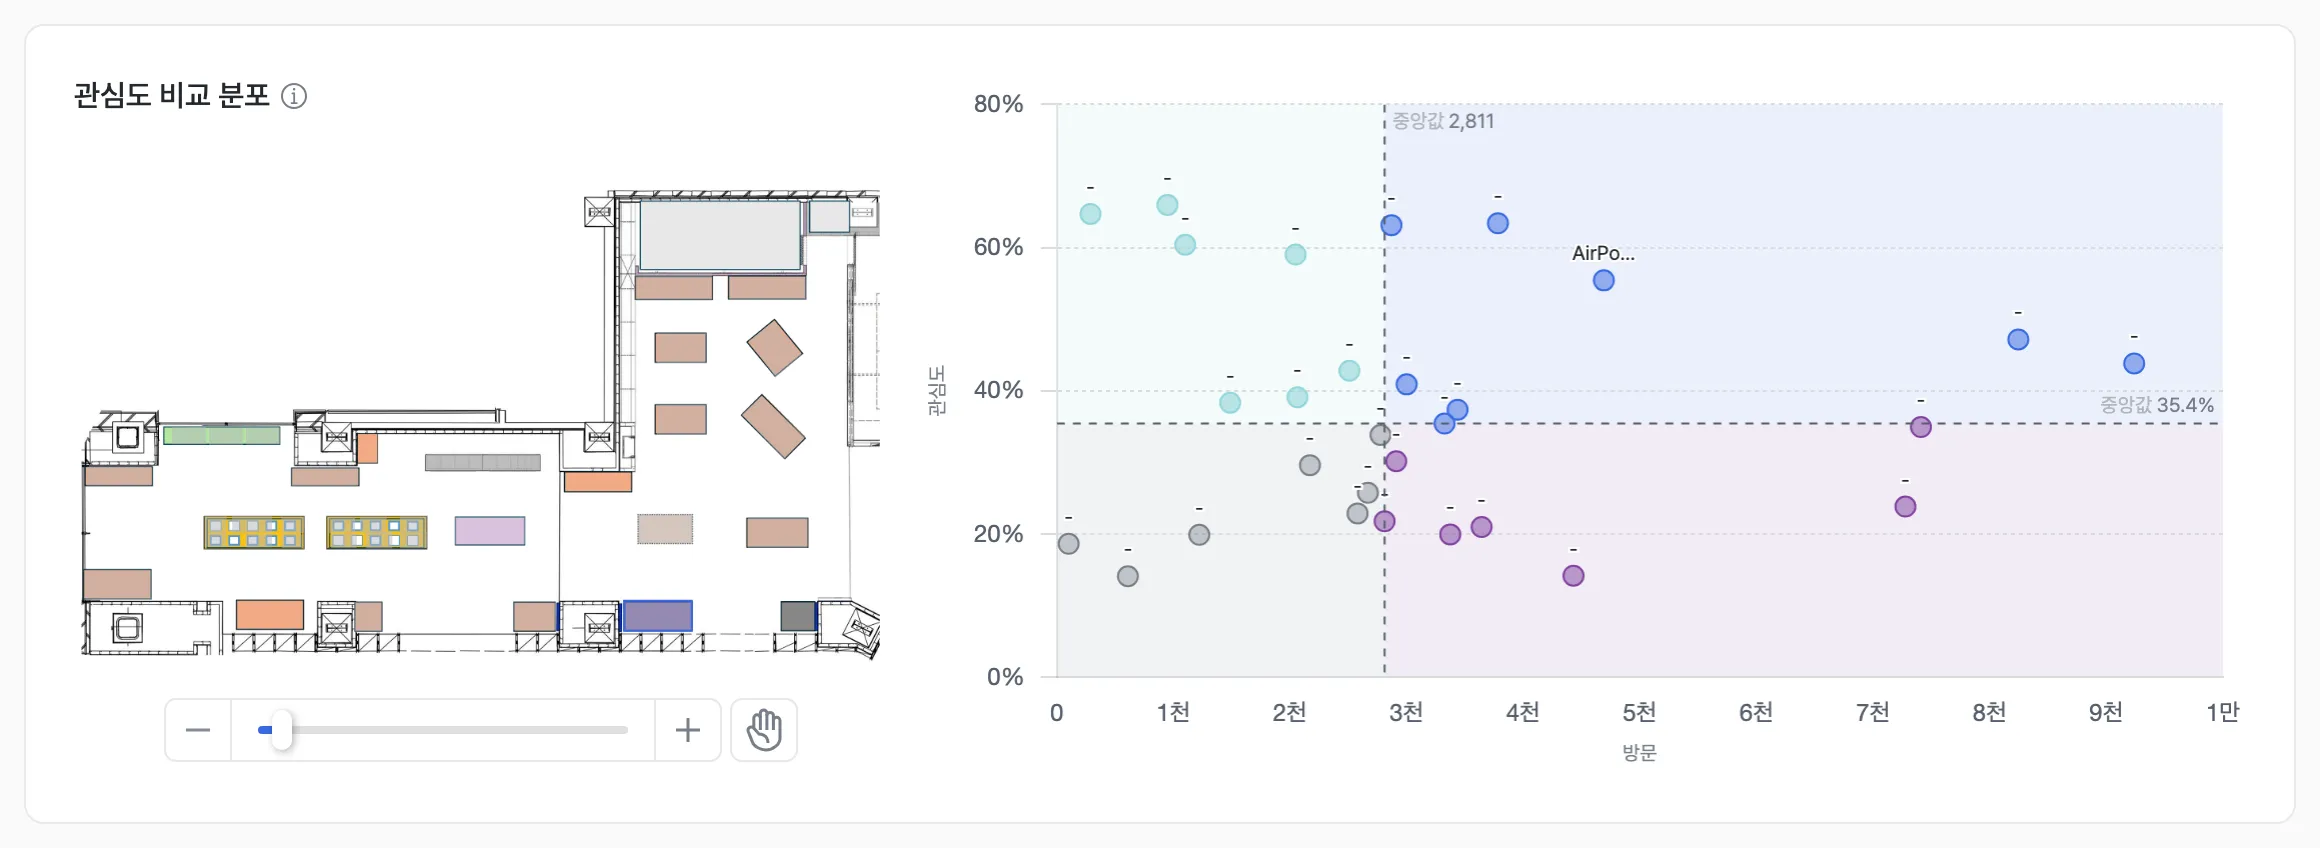
- Each product’s visits (horizontal axis) and interest rate (vertical axis) are plotted in quadrants divided by the median visits and the median interest rate.
- The map on the left shows where each product (display stand) is in the store.
| Quadrant | Meaning | Interpretation |
|---|---|---|
| Visits ↑ · Interest rate ↑ | Products many customers come to and show high interest in | The store’s core products. Keep the current position and presentation |
| Visits ↓ · Interest rate ↑ | Few customers come, but those who do show high interest | Hidden favorites. Consider moving to a higher-traffic position |
| Visits ↑ · Interest rate ↓ | Many customers pass by but few become interested | Consider improving presentation, product information, and hands-on elements |
| Visits ↓ · Interest rate ↓ | Both visits and interest rate are low | Review the position and product lineup overall |
Detailed zone interest analysis
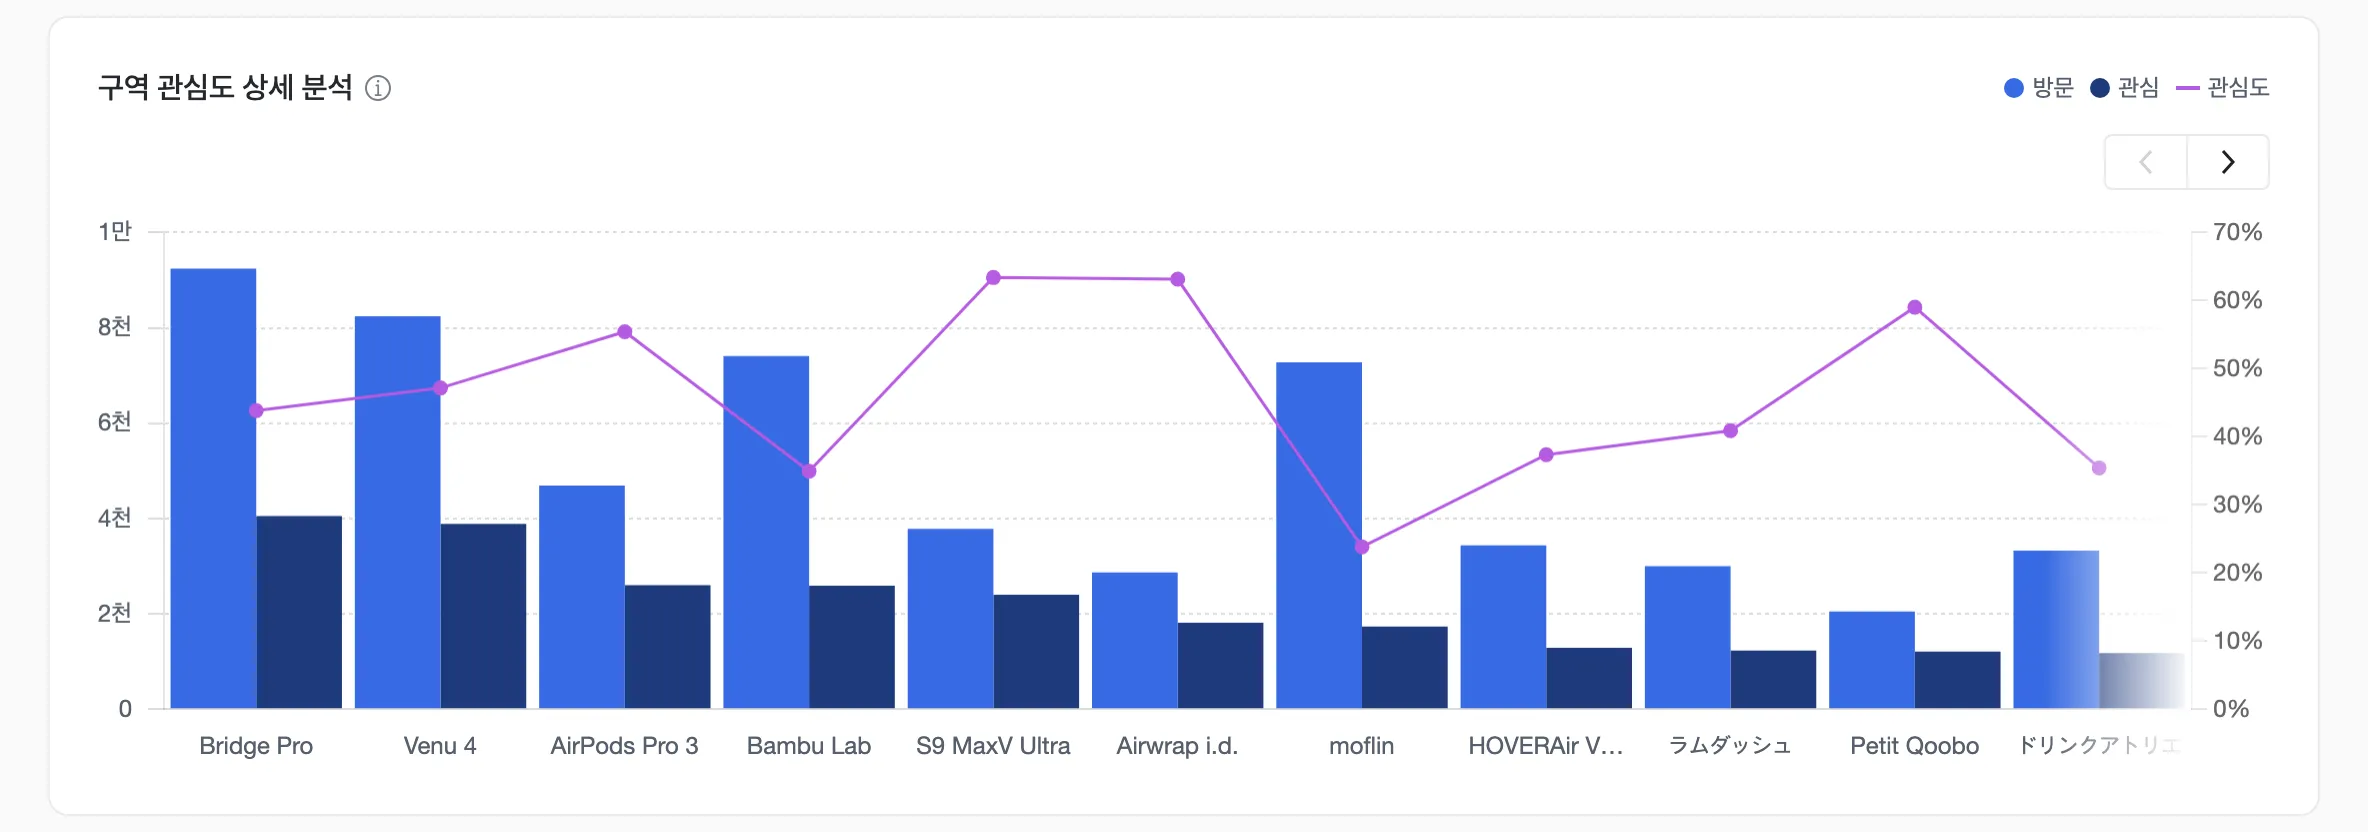
- Compares visiting and interested customers as bars with the interest rate as a line for each product.
- When there are many products, use the arrow buttons at the top right to see the next products.
Examples
- Find products with many visits but a sharply lower interest-rate line to set improvement priorities.
- Compare visits and interest rate before and after a product swap.
Product interest table
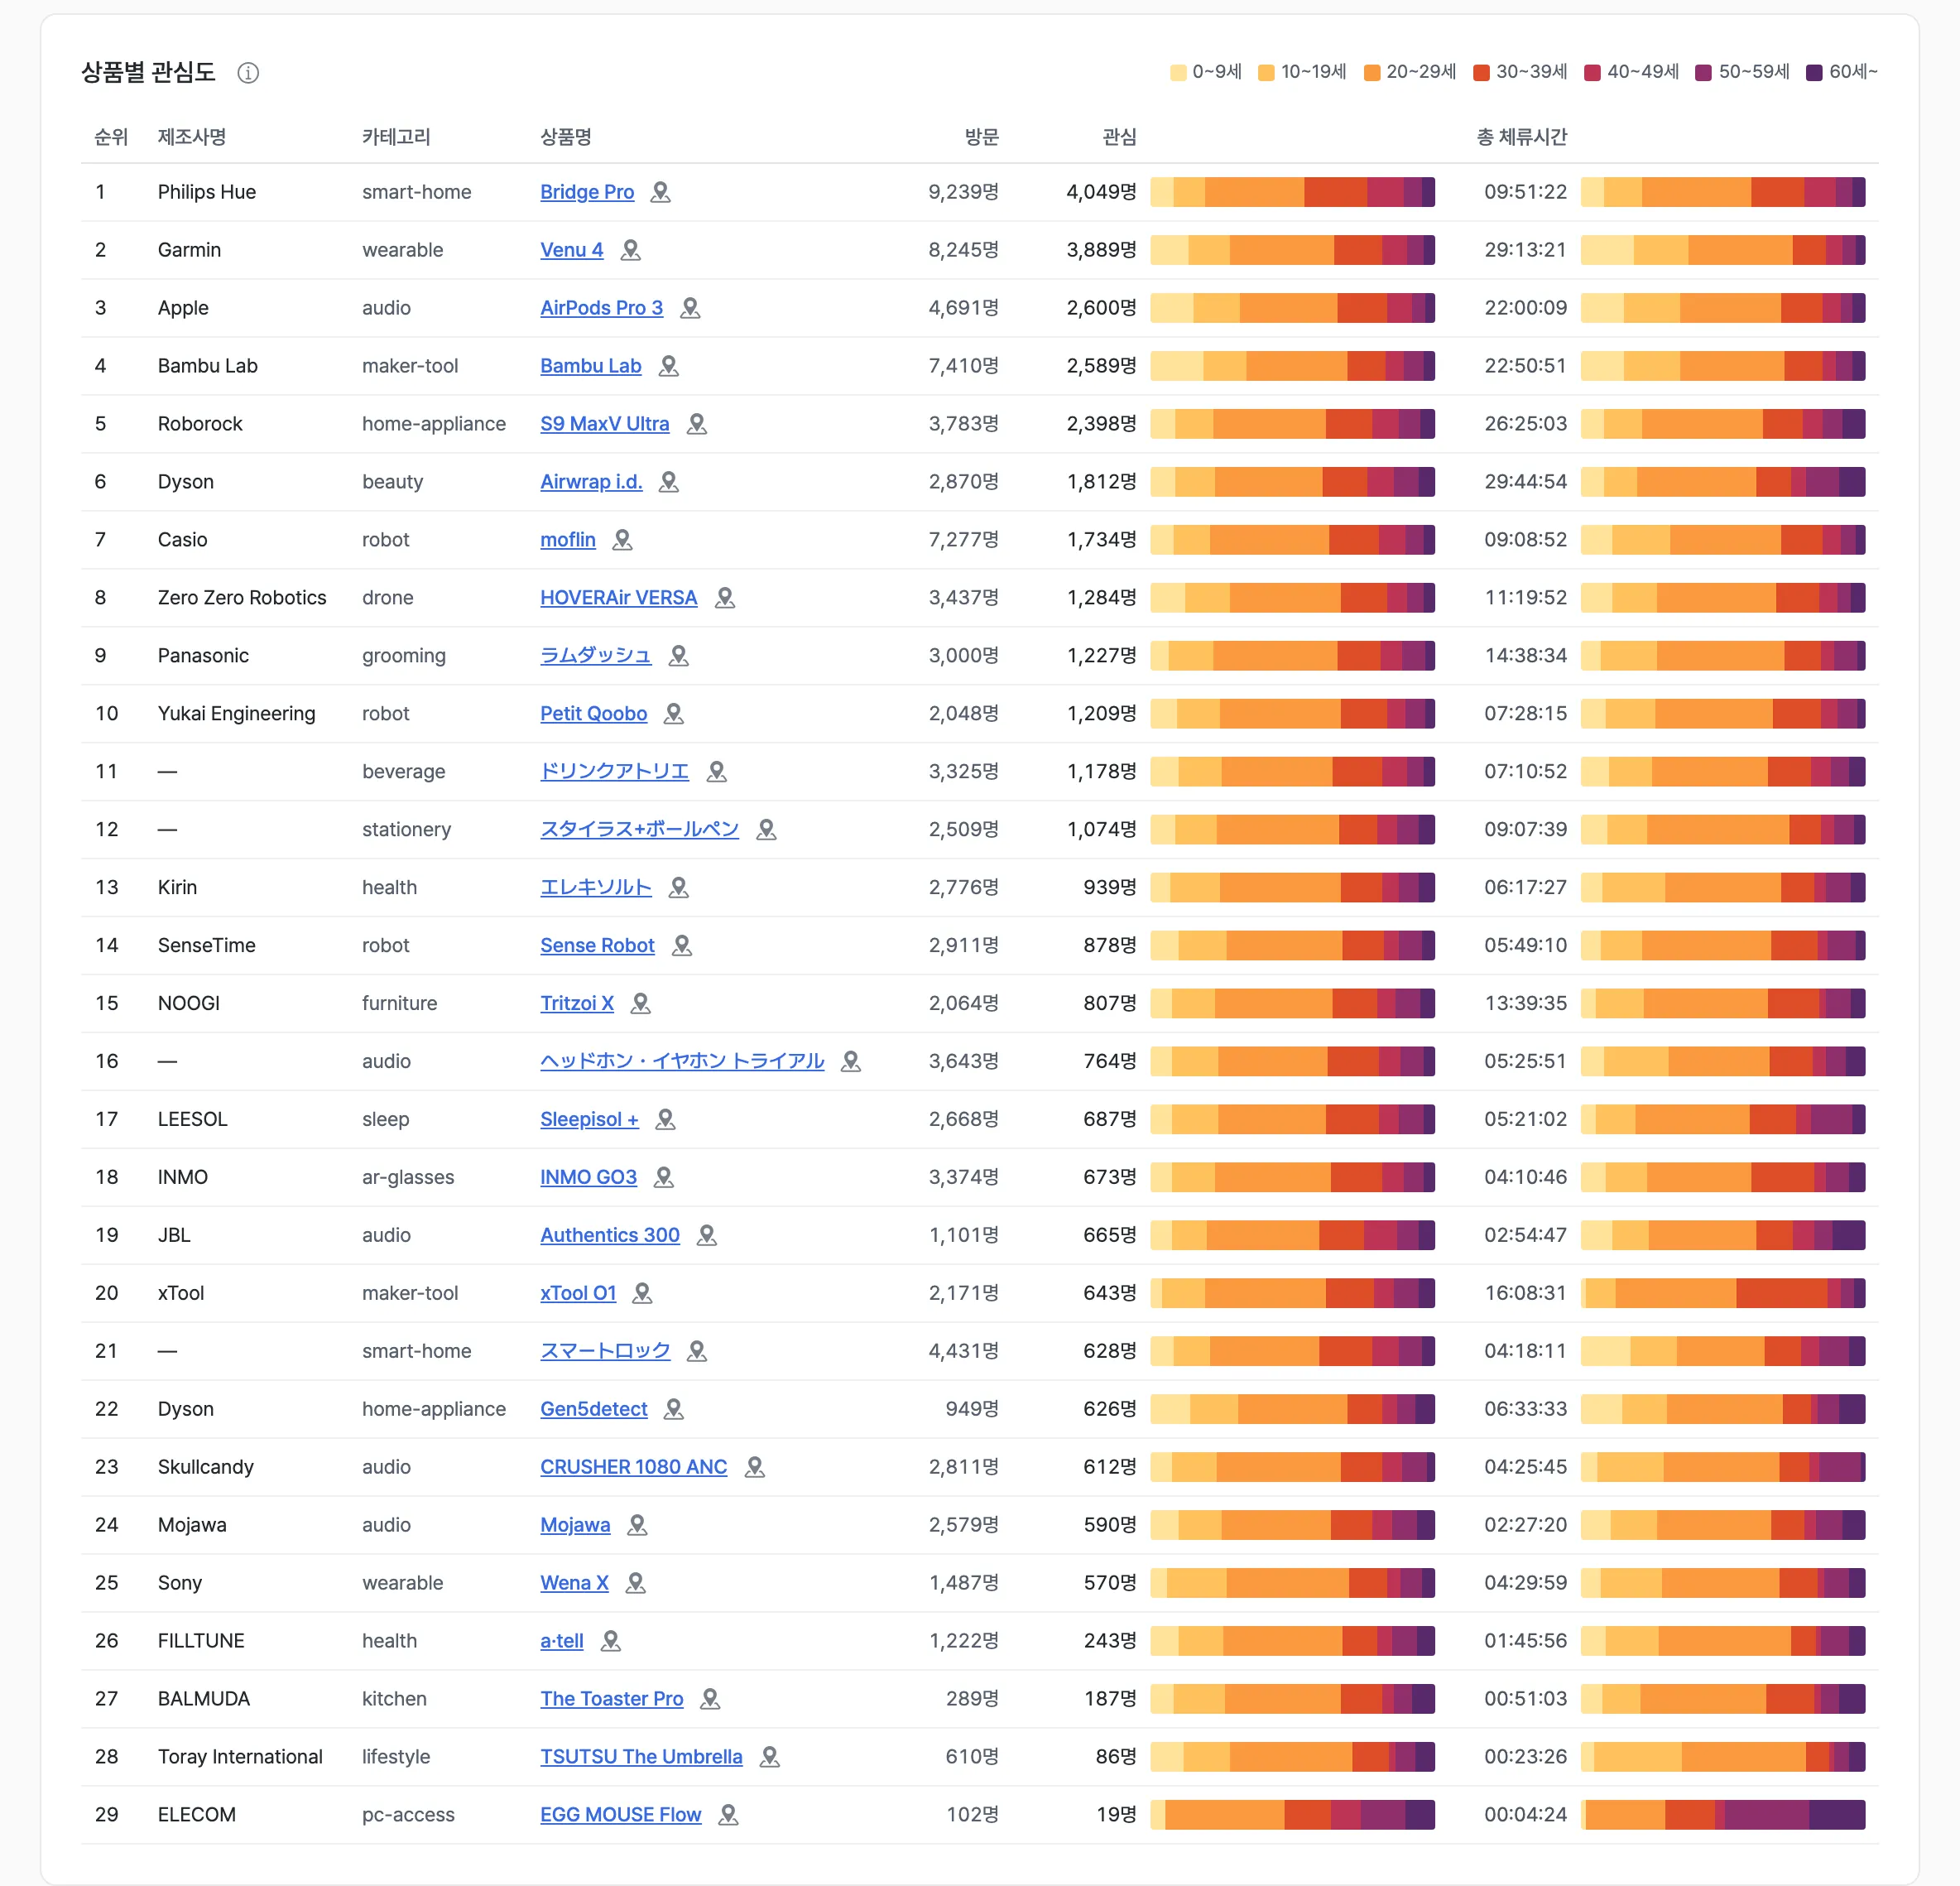
- Lists the rank, maker name, category, product name, visits, interest, and total dwell time per product.
- The colored bars next to interest and total dwell time show the age-group makeup (0–9 through 60 and over).
- The maker name and category come from the maker name and tag assigned to the display stand in Zone Config.
- Click a product name to open that product’s detail screen.
Product detail
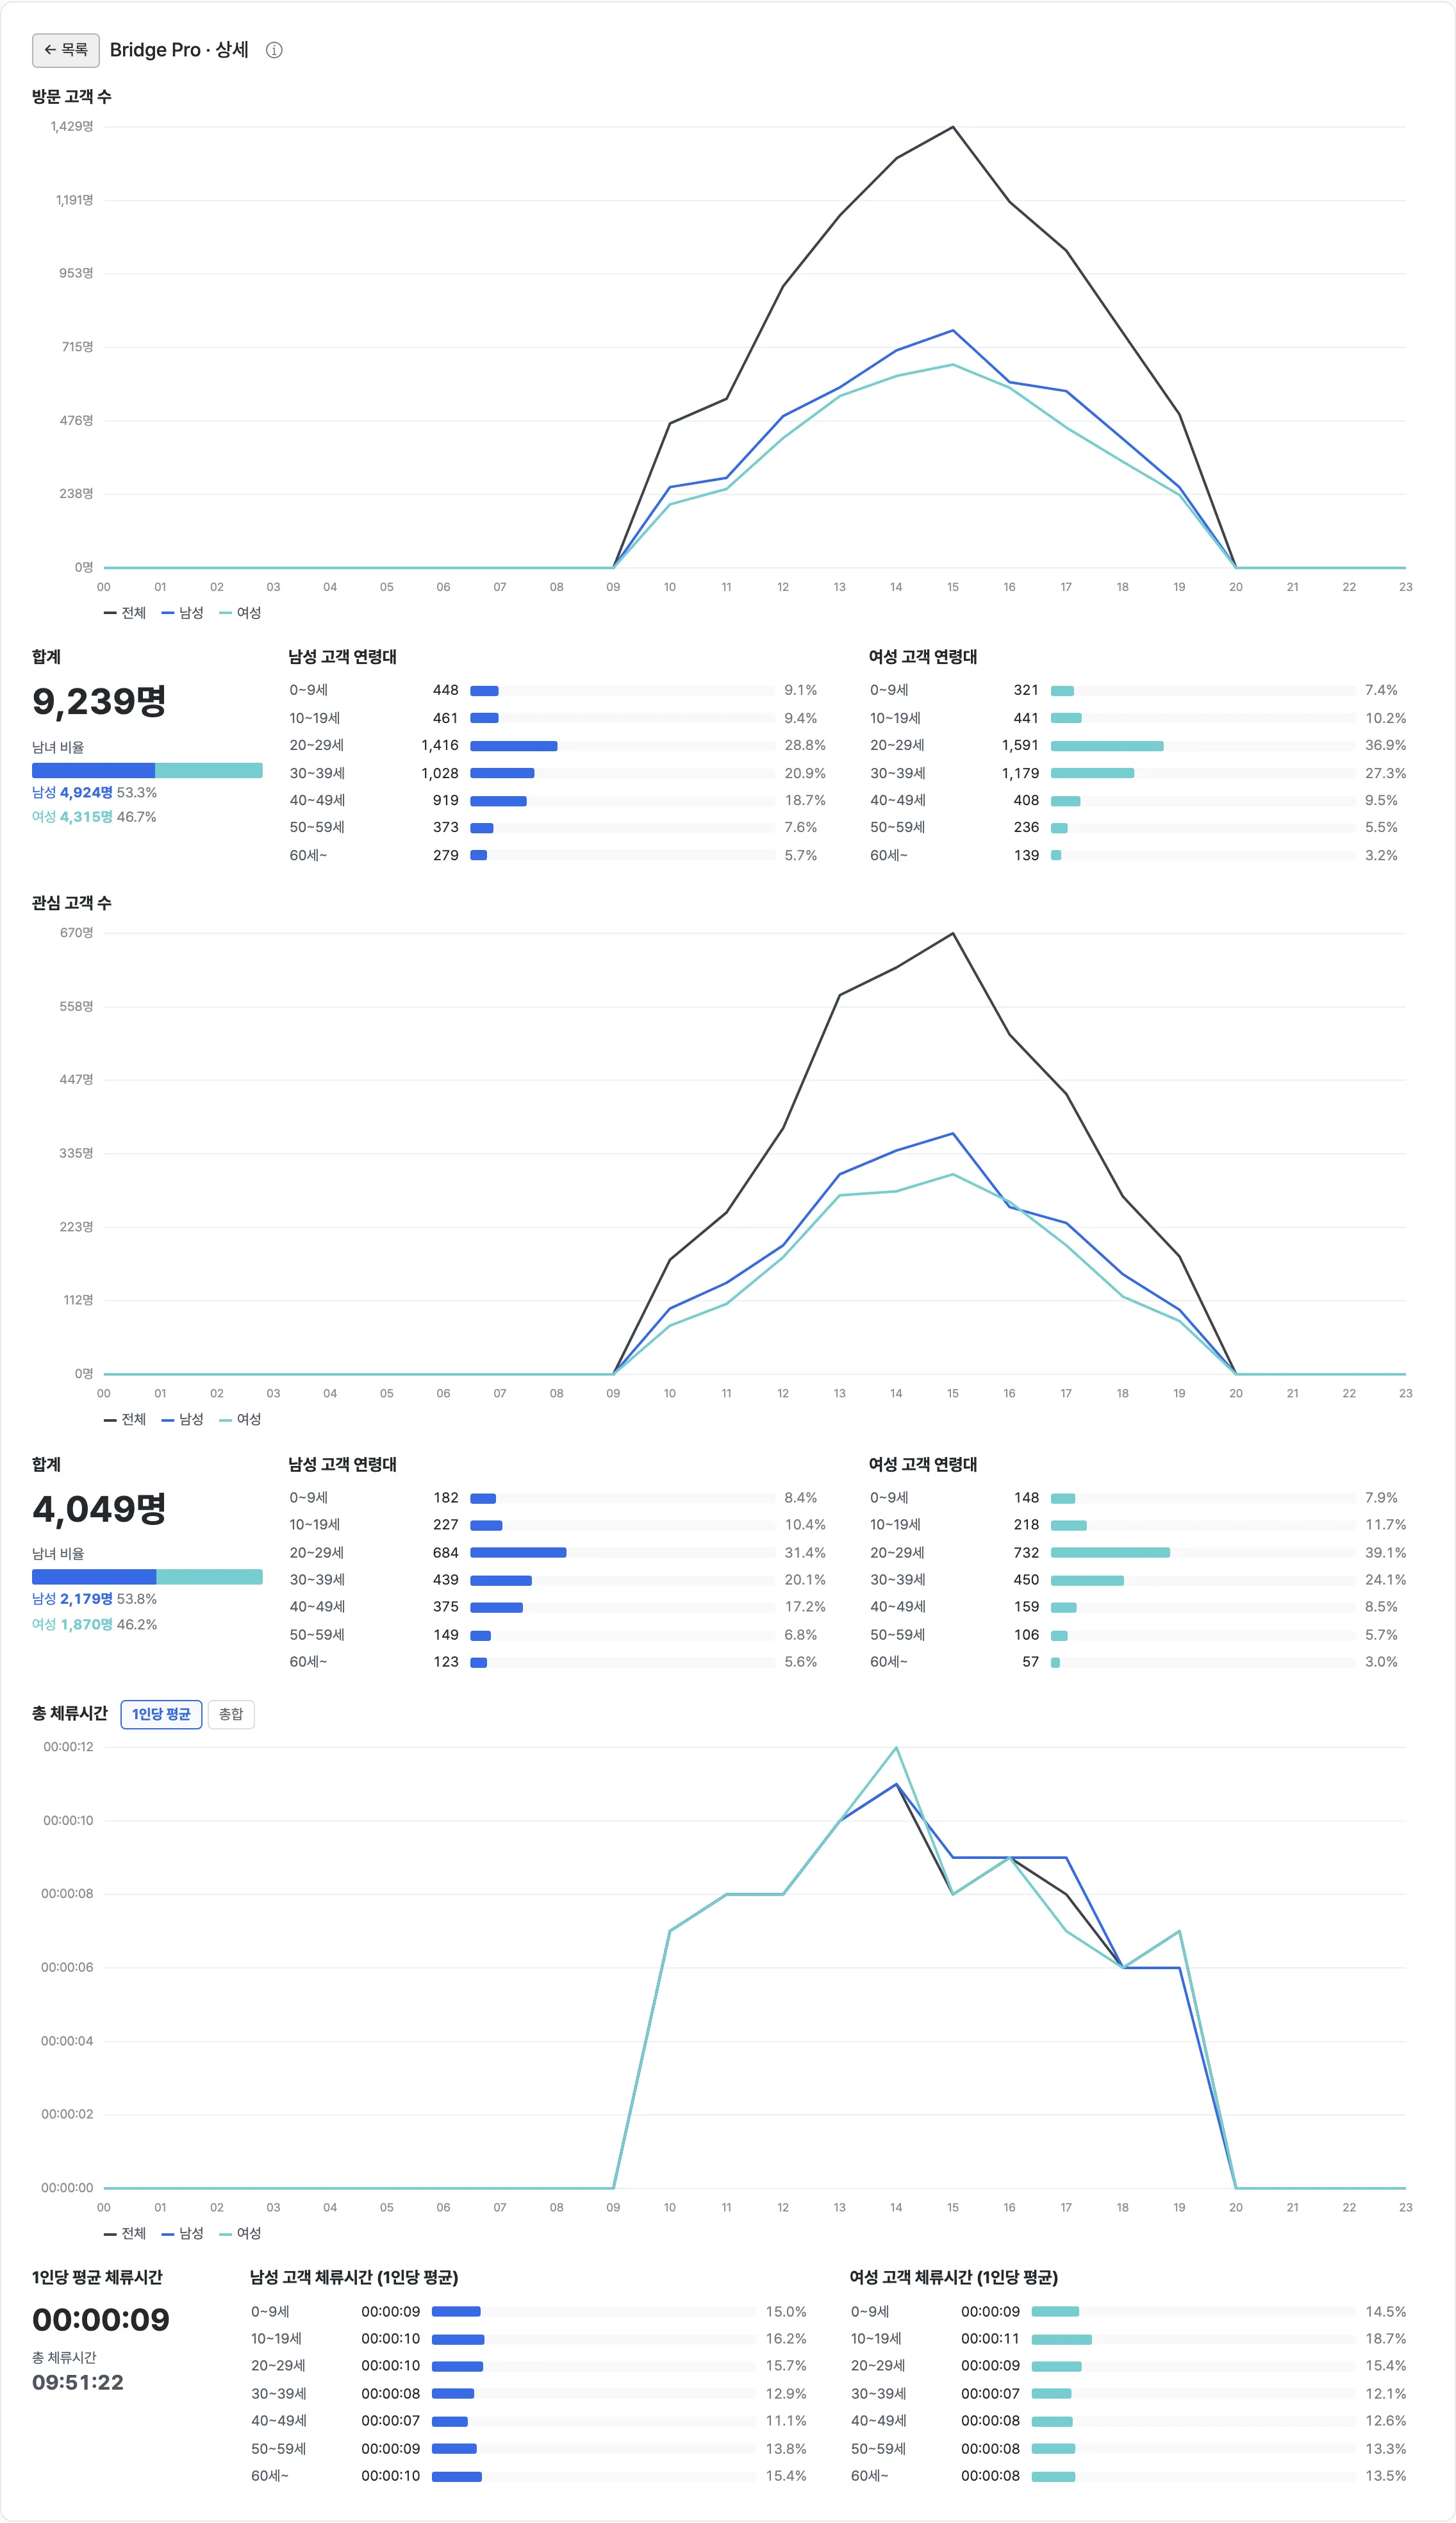
- Visiting customers / Interested customers: shows the hourly trend for all, male, and female customers, with the total, the male-to-female ratio, and the age makeup by gender.
- Total dwell time: switch between average per person / total with the buttons; dwell time by gender and age group is shown as well.
- Click ← List at the top left to return to the product interest table.
Examples
- Identify the gender and age of customers interested in a product to verify they match its target customers.
- Assign demo and consultation staff to the hours when interested customers concentrate.
- Compare the age makeup of visiting and interested customers to find the segments that don’t convert to interest.
What a customer account sees
When a customer account is issued, only the products of the maker linked to the account are shown. All other products appear in the report with their identifying information hidden.
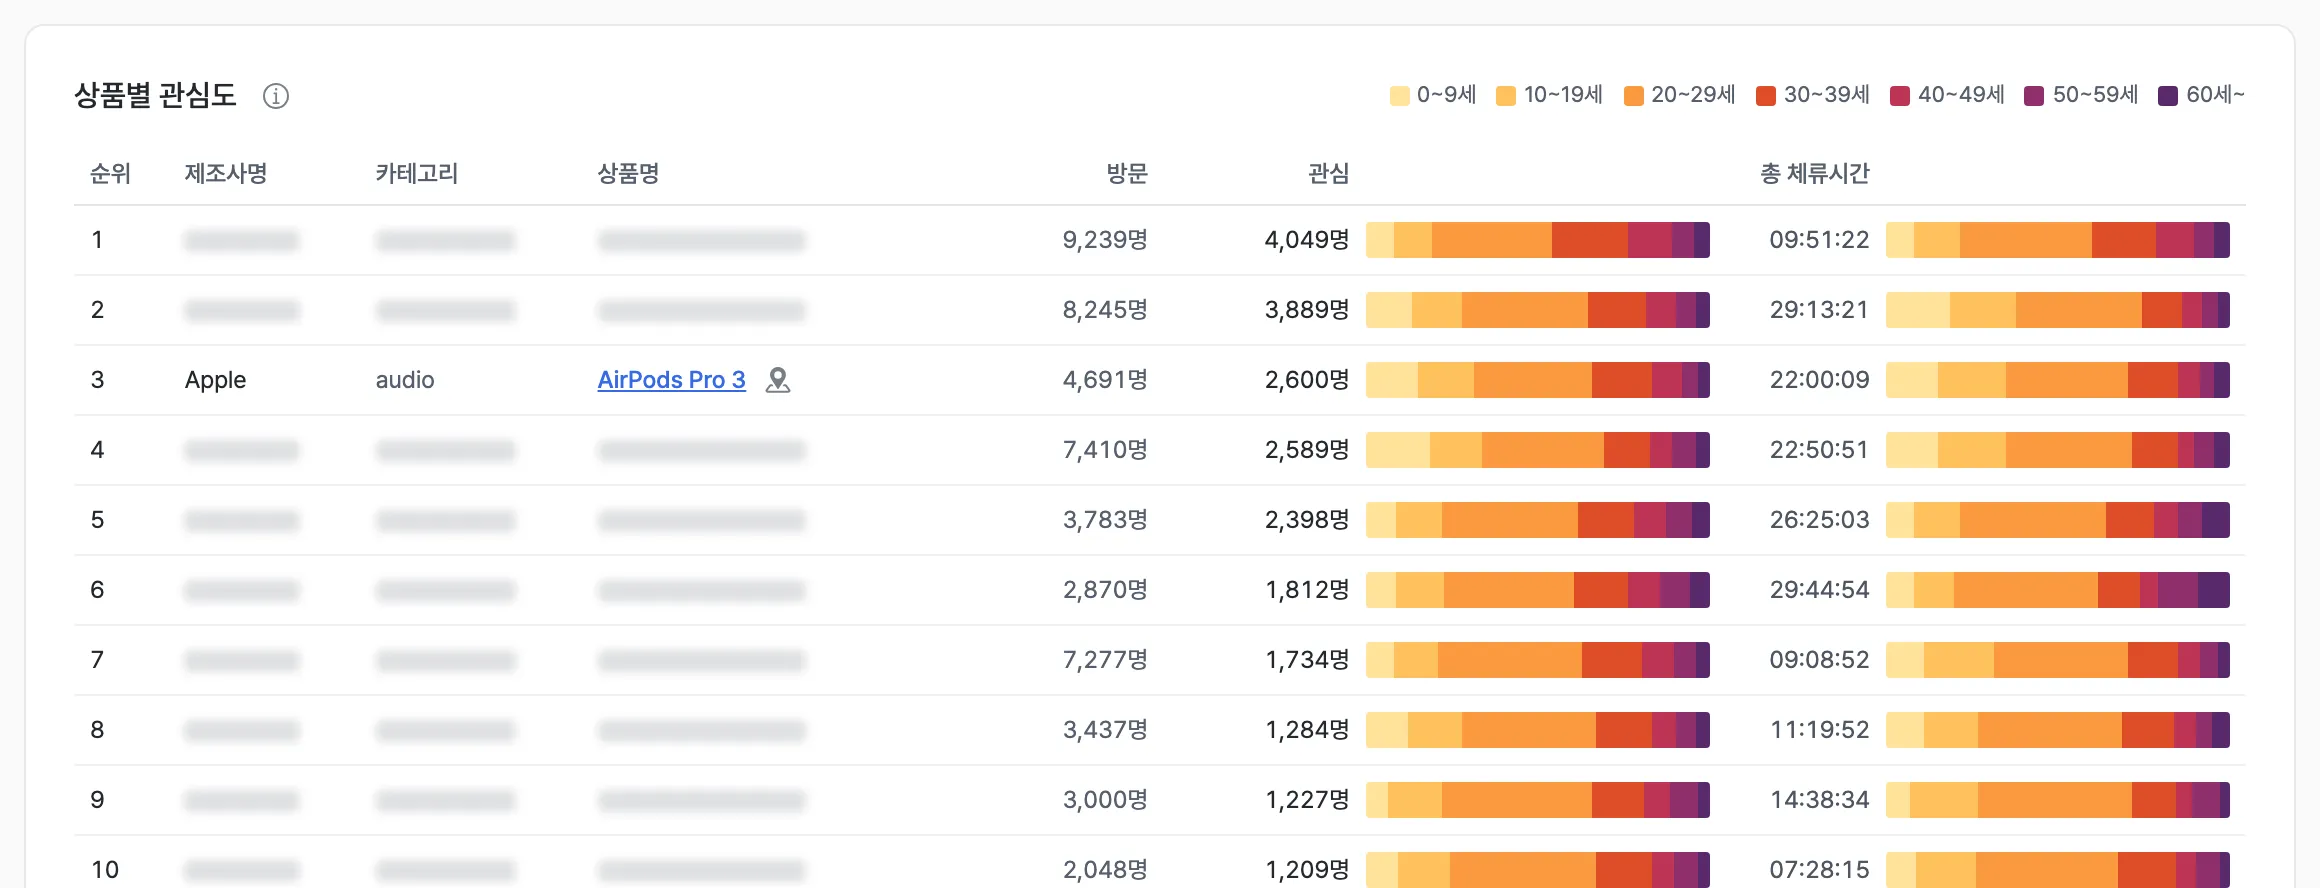
- For all other products, the maker name, category, and product name are blurred, and they are shown as hidden in the charts.
- The rank and the visit, interest, and total dwell time figures are still shown, so even without knowing what the other products are, you can compare where the linked maker’s products stand across the whole store.
- The product detail screen can be opened only for products of the maker linked to the account.
- The left menu shows only the Visitor Info and Product Interest reports, and the settings screen cannot be opened.
Key metrics (KPIs)
| Metric | Description | Insight |
|---|---|---|
| Visits | Customers who entered the zone in front of the display stand | Check the exposure effect of the product’s position |
| Interest | Customers who looked at the display stand for at least the threshold time | Check the scale of interest the product actually drew |
| Interest rate | Ratio of interest to visits | Evaluate the appeal of the product and presentation itself, independent of position |
| Total / average dwell time | Time interested customers spent in front of the display stand | Evaluate engagement with the product |
| Gender / age makeup | Share of visiting and interested customers by gender and age group | Verify fit with target customers |