

Heatmap by time
Heatmap by time visualizes customer activity along the time axis. While the standard Heat map is a static “all-day summary,” Heatmap by time lets you watch density and movement change continuously, like a time-lapse video. You can quickly identify when and where the store gets crowded and which times suffer reduced operational efficiency.
Report layout
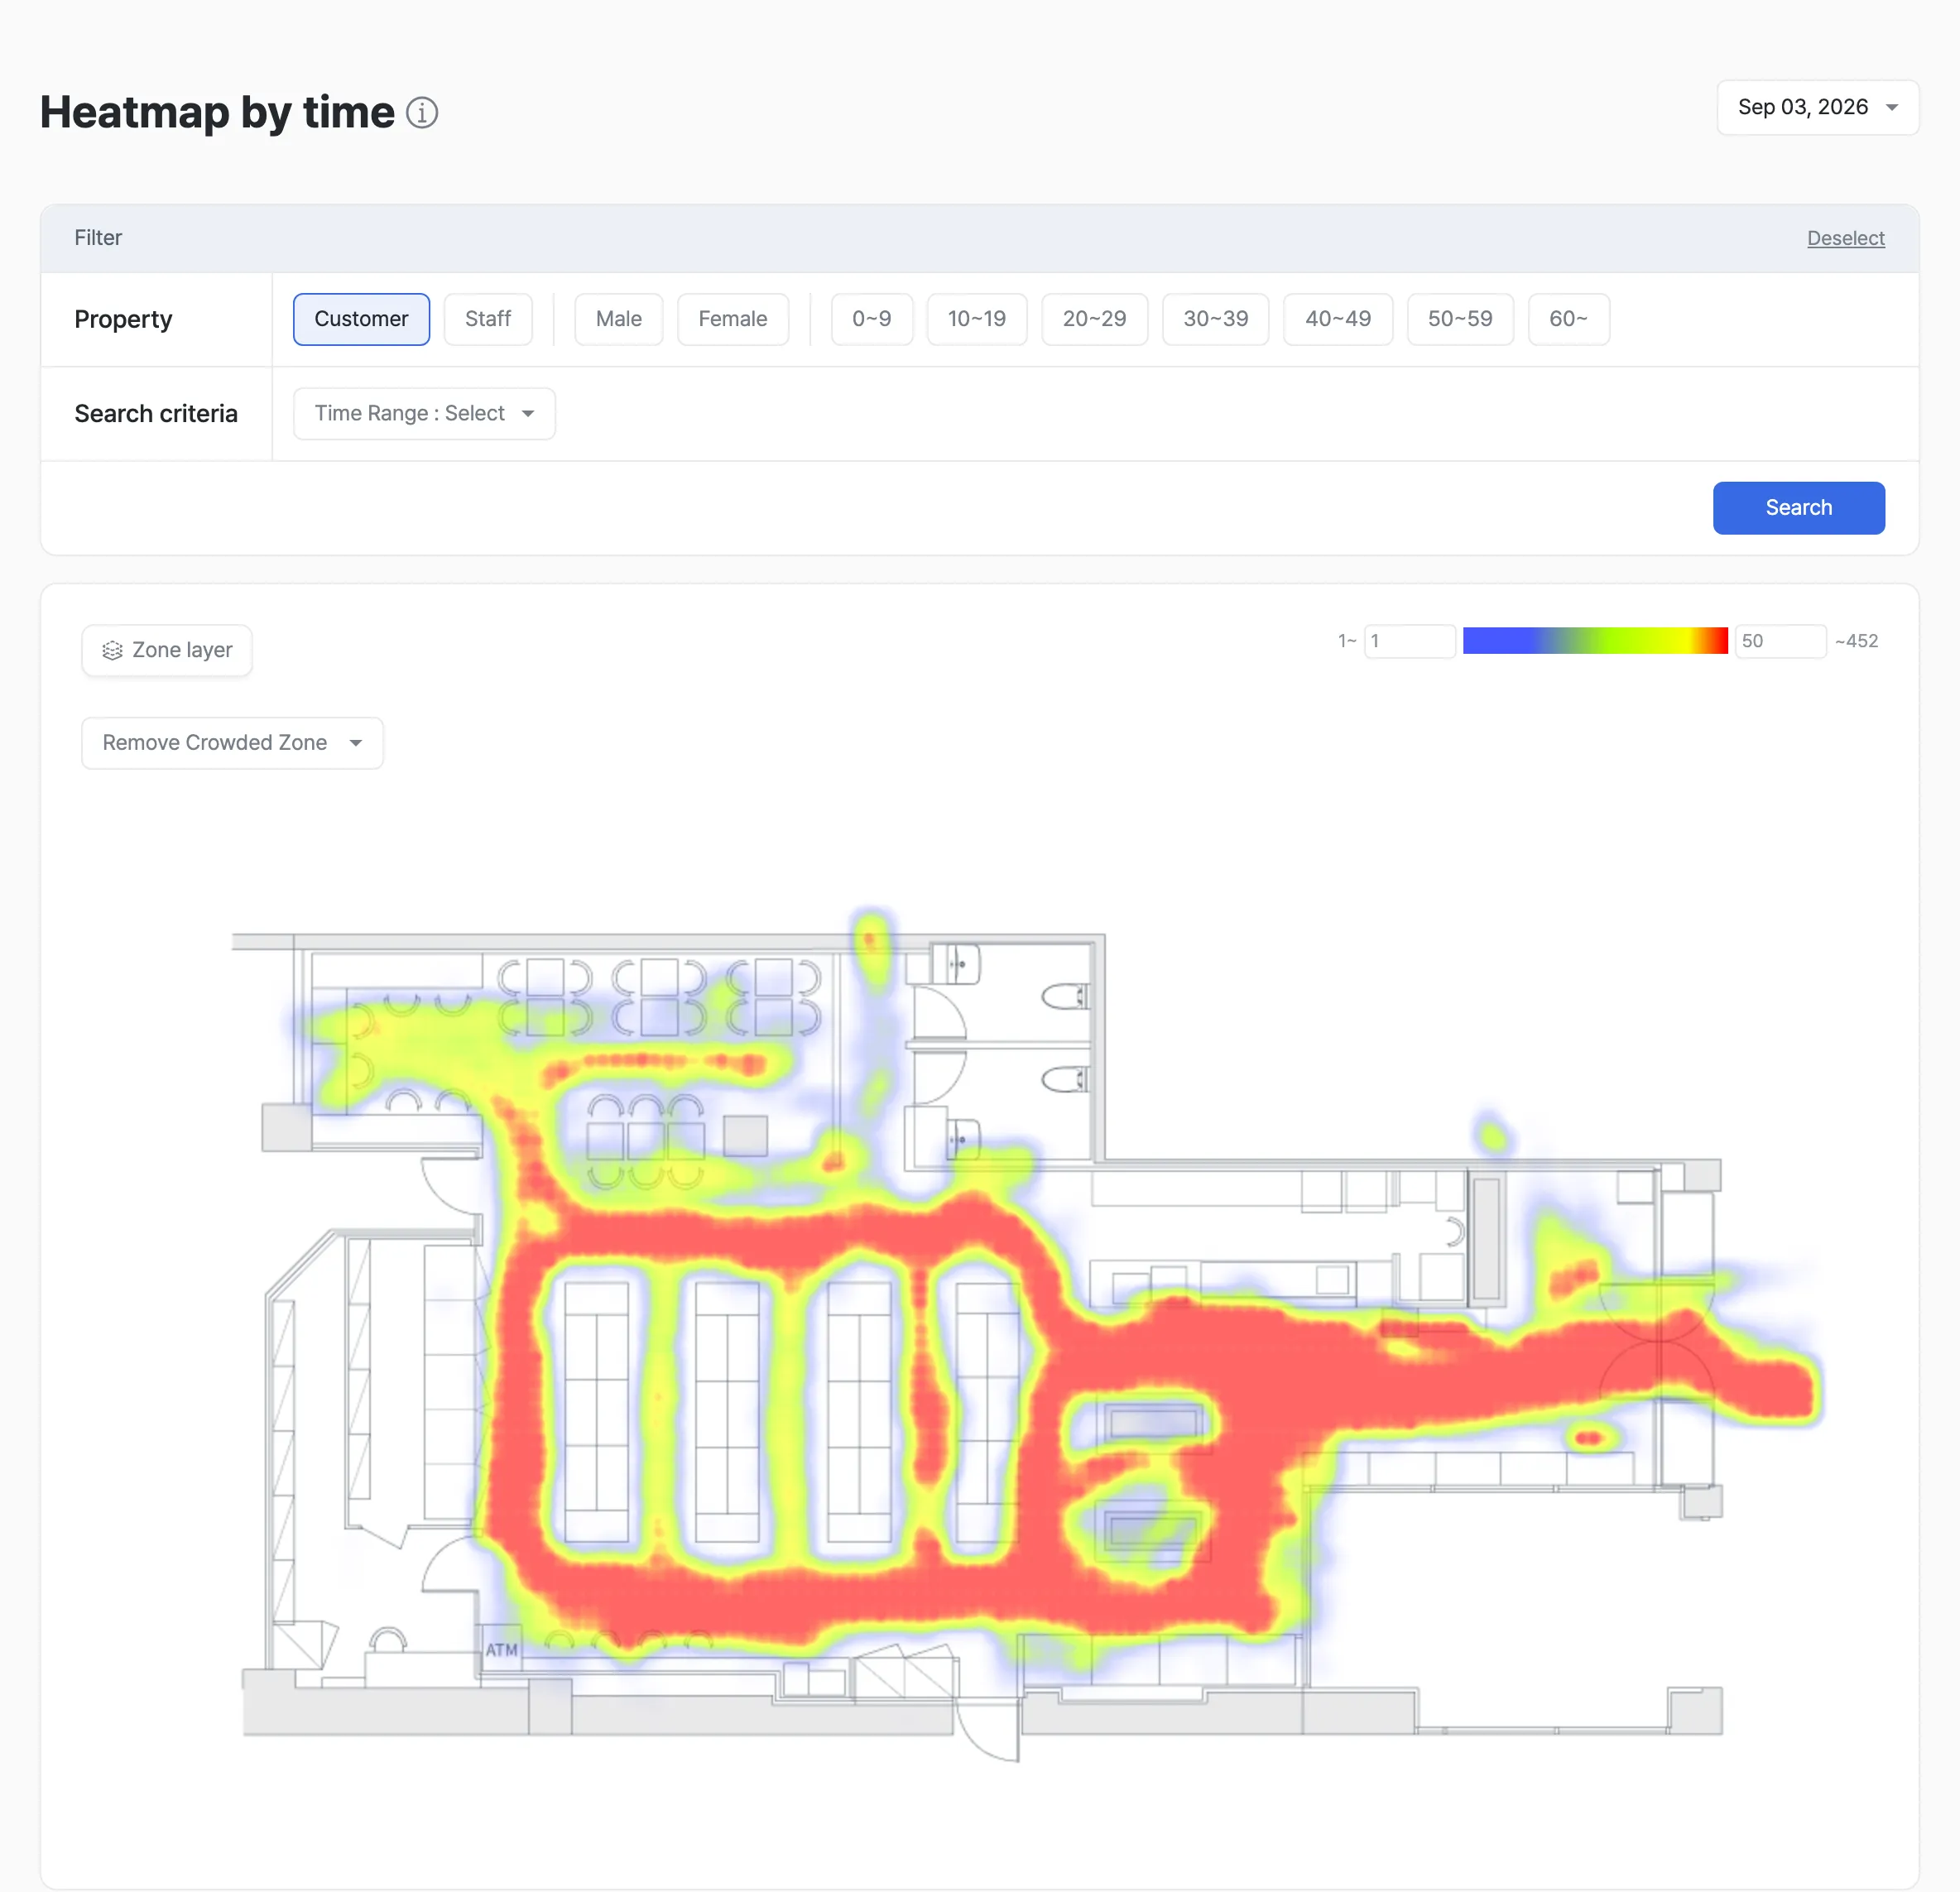
In-depth Visit-based analysis
- Analyze the Visit-based heatmap by time of day.
Examples
- Identify zones that get crowded at specific times and manage congestion.
- Find zones with relatively low visits and place strategic merchandise there to redistribute traffic.
Activity visualized over time
- Use filters to view changes in customer activity at one-hour intervals.
- Track how red and blue color distributions shift by time of day to follow congestion changes in the space.
Examples
- Track how peak times shift precisely (for example, 12:30 lunch-box corner → 12:50 checkout).
- Discover localized hotspots that occur only at specific times and run target marketing.
Dynamic resource allocation
- Optimize the placement of staff, checkouts, and inventory based on visit density by time of day.
Examples
- Maintain minimum staffing during quiet hours, then redeploy staff to focus on customer service at peak times.
- Optimize checkout operations around lunchtime to minimize wait times.
Time-targeted marketing
- Plan your marketing timing using time of day + zone activity + customer group (gender / age group) behavior.
Examples
- Plan marketing around the zones and times specific customer groups visit.
- If women in their 30s actively visit the baby-products corner around 10 a.m., plan a “Mom’s Time” flash sale at that hour.
Expected outcomes
Operational optimization
- Flexibly adjust staff, facilities, and inventory based on traffic by time of day.
- Reduce waste and maximize efficiency.
Better marketing performance
- Plan marketing around the times and zones where customers gather.
- Deliver the right message and increase marketing conversion.
Better customer experience
- Anticipate crowded times and pre-staff in advance.
- Minimize the stress of waiting and increase shopping satisfaction.
Use cases
- Peak-time operations — Identify path bottlenecks during peak hours and reposition staff.
- Time-of-day campaigns — Design different promotion messages for lunch, evening, and other windows.
- Event impact measurement — Track traffic changes during the hours of an event.
Advanced tips
Track changes by hour and set baselines
- Compare with historical data:
- Compare with the heatmap from the same day of the week and the same hour in the prior week or month.
- Diagnose how external factors — promotions, display changes, weather — affect visit traffic.
- Confirm a normal traffic range:
- Compare customer activity at a specific hour with average visit patterns to use as a baseline that determines whether a hotspot or cold zone is temporary or structural.
- If a normally red zone turns blue at a certain hour, it signals the need for an operational check.
Time-of-day comparison by target
- Compare time of day by gender and age group:
- Separate the target groups and compare their Heatmap by time results.
- Confirm that different customer types show interest at different hours in the same space, and design tailored strategies.
Example workflow
The following is a multi-step analysis flow built around Heatmap by time.
- Find the rhythm — From Heatmap by time, spot that the “appliances corner” gets crowded at 3 p.m. on weekends.
- Trace the path — Use [Main path] to see which routes brought customers to the zone.
- Diagnose performance — Use the [Zone interest analysis] matrix to determine whether the corner is a “leaky bucket” (high visits, low interest).
- Validate conversion — Use [Purchase conversion analysis] to confirm whether sales actually occur at that hour.
- Execute and measure — Based on the validated evidence, invest resources at that hour (POP repositioning, staffing, etc.).